Best Practices: Creating Data Flows in WebFOCUS
Browse these Best Practices for creating data flows in WebFOCUS.
Best Practice
|
Browse these Best Practices for creating data flows in WebFOCUS.
Best Practice
|
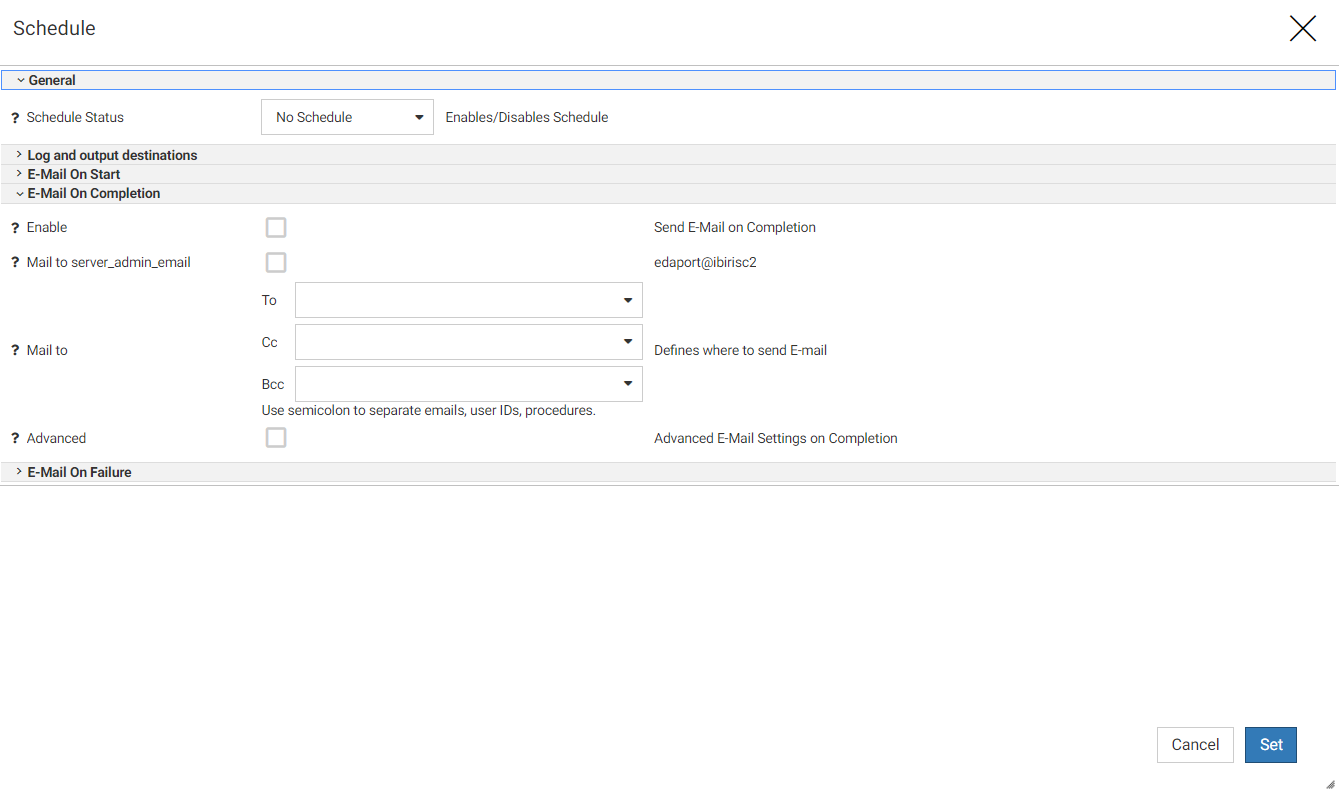
You can create a schedule that will run a data flow on a specified data and time, or on a recurring basis. You can configure where the logs and outputs are sent. You can also send emails on start, completion, or failure.
To create a schedule for a flow, click the Schedule and E-Mail button (![]() ) on the ribbon.
) on the ribbon.
The Scheduler window opens, as shown in the following image.
You can create a Business View for the target to categorize the columns into measures and dimensions. This view of the data is used by Designer for creating reports and charts.
Right-click the target and select Edit Business View. The Synonym Editor opens, as shown in the following image.

Once a data flow contains all of the fields you need, you can load it to a target data store.

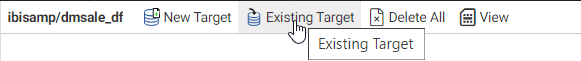
A file picker opens, so you can select the existing target.
You can add multiple sources in a data flow as joins or unions.
You can add new fields or replace existing fields by creating expressions. You can do this by right-clicking a field in the query, or by using the menu for a field in the sample data panel.
Each field in the sample data panel has a menu icon ( )
)
The menu provides the following options:
To edit the fields in the flow, right-click the SQL object, and click Edit. The Metadata and Query panes open.
When a data source in a flow has a large volume of data, you can enable sampling for better response time. You can make decisions based on a sample, provided that sample is representative of the entire data set. Data Prep has a built-capability to automatically generate a random sample (with a 99% confidence level and +/- 1% margin of error).
To enable sampling:
Your data may be arranged and structured in different ways depending on the size and amount of detail that it provides. Smaller data sources may be saved in a single spreadsheet or flat file, such as a CSV file, making them easy to access and distribute. Larger data sources, however, may contain too many records or fields to efficiently store in a single file.
After uploading or connecting to data by clicking Get Data from the Reporting Server browser interface, you can return to the Reporting Server browser interface to prepare or manage more data, or if you choose, visualize your data in WebFOCUS Designer.
From the WebFOCUS start page, click Applications Directories, or, from the Home Page, click the plus menu ![]() , and then click Prepare and Manage Data.
, and then click Prepare and Manage Data.