Technical Blog

True to the form of any good language, FOCUS includes more than one way to connect multiple data sources to use their combined data for reporting, graphing, or charting. The most common connection is JOIN, which in its many variations—JOIN to UNIQUE, JOIN to MULTIPLE, DEFINE-based JOIN, WHERE-based or conditional JOIN, and recursive JOIN—allows data in one file to be connected and correlated with data in a second file. The JOIN command establishes the conditions of the connection between two files.
The world's largest privately funded nonprofit organization, with 2.8 million volunteers, 10.3 million donors, and nearly $5 billion in annual contributions.
The Challenge. United Way needed to help its worldwide network of 13,000 employees understand which partners have the best performance and which programs are the most successful.
Keeping an eye on IoT
What Is the Internet of Things (IoT)?
The Internet of Things (IoT) is an ecosystem that includes physical devices and objects, as well as the hardware, software, and sensors, that communicate over an IP network, enabling those devices and objects to collect and share data.
The Challenge. Generate performance-return records for millions of accounts, which involves building and storing more than one billion account-return records each night.
The Strategy. Create flexible and highly scalable information-delivery and analysis capabilities; use WebFOCUS to process performance returns and simplify account oversight.
Learn how iWay handles blockchain integration.
Blockchain Buzz
A blockchain is a distributed record of transactions validated and stored at multiple peer locations in a network. The records form a consensus of replicated, shared, and synchronized information. For example, the debits and credits applied to a bank’s accounts might be stored in the blockchain. The ledger (blockchain) is not the record of the accounts themselves, but rather the changes in account position.
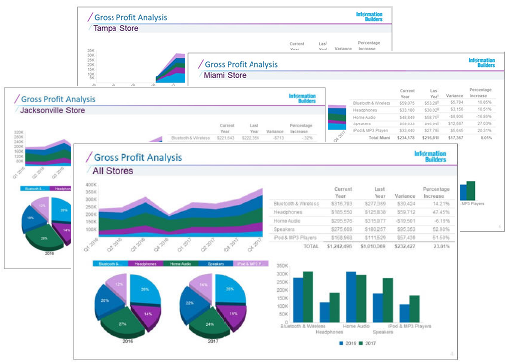
Use WebFOCUS to present your data within your corporate PowerPoint templates.
Did you know that you can generate complete, informative, and professionally styled presentations that are dynamically populated with the latest data available in your enterprise? You can combine the power of WebFOCUS and PowerPoint® to use your corporate presentation templates to showcase your corporate data and add timely commentary.
Transform column data display with ACROSS.
One of the most powerful phrases in the FOCUS language—ACROSS—allows you to generate a matrix of data in the simplest and most direct way, comparing any two or more dimensions. For instance:
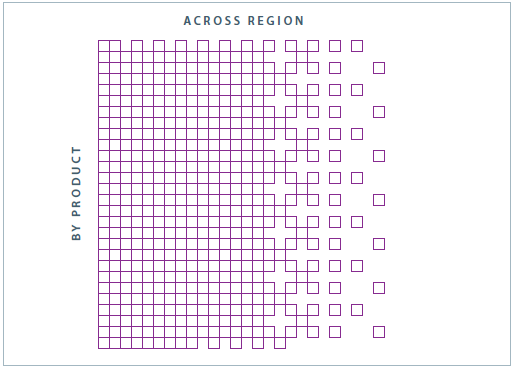
And when you use this construction, there are a number of aspects of the ACROSS column processing and display that you might wish you could change. Well, most likely, you can!
The FOCUS language supports a remarkable range of functionality, all centered around a single aggregating or detail-generating pass through the data. It includes sorting, selection, virtual field creation (both at retrieval time and prior to output time), text insertion, and subtotaling and grand totaling within the sort. Verb object prefixes allow you to modify the data. Functions can be applied both in expressions and directly to verb objects. There is a range of styling that opens the door for the artist in every one of us.

Infographics are fast becoming the preferred method of delivering government, corporate, and other organizational information to large numbers of information consumers. Infographics are replacing dashboards and large reports, and information consumers love them because infographics are quick and easy to understand. Information Builders WebFOCUS Infographics offer the ability to use your existing data to build powerful, visual stories that can be personalized and bursted to millions of users.