Running a Data Flow
When you have made all of the data preparation transformations for a flow, and have added your target, on the toolbar click the Run button ( ).
).
When the data is loaded, a report similar to the following displays.
Now that we’re situated in our environment, let’s get ready to create some content. In order to create that content, we’ll need access to data. Whether you’re using data from a spreadsheet or a database, WebFOCUS makes it easy to bring data into your environment so you can start exploring it.
If you’re using a spreadsheet, CSV file, or other local file as a data source, do a data upload. Click the Get Data option on the Home Page and select the format in which your data is saved.
When you have made all of the data preparation transformations for a flow, and have added your target, on the toolbar click the Run button ().
When the data is loaded, a report similar to the following displays.
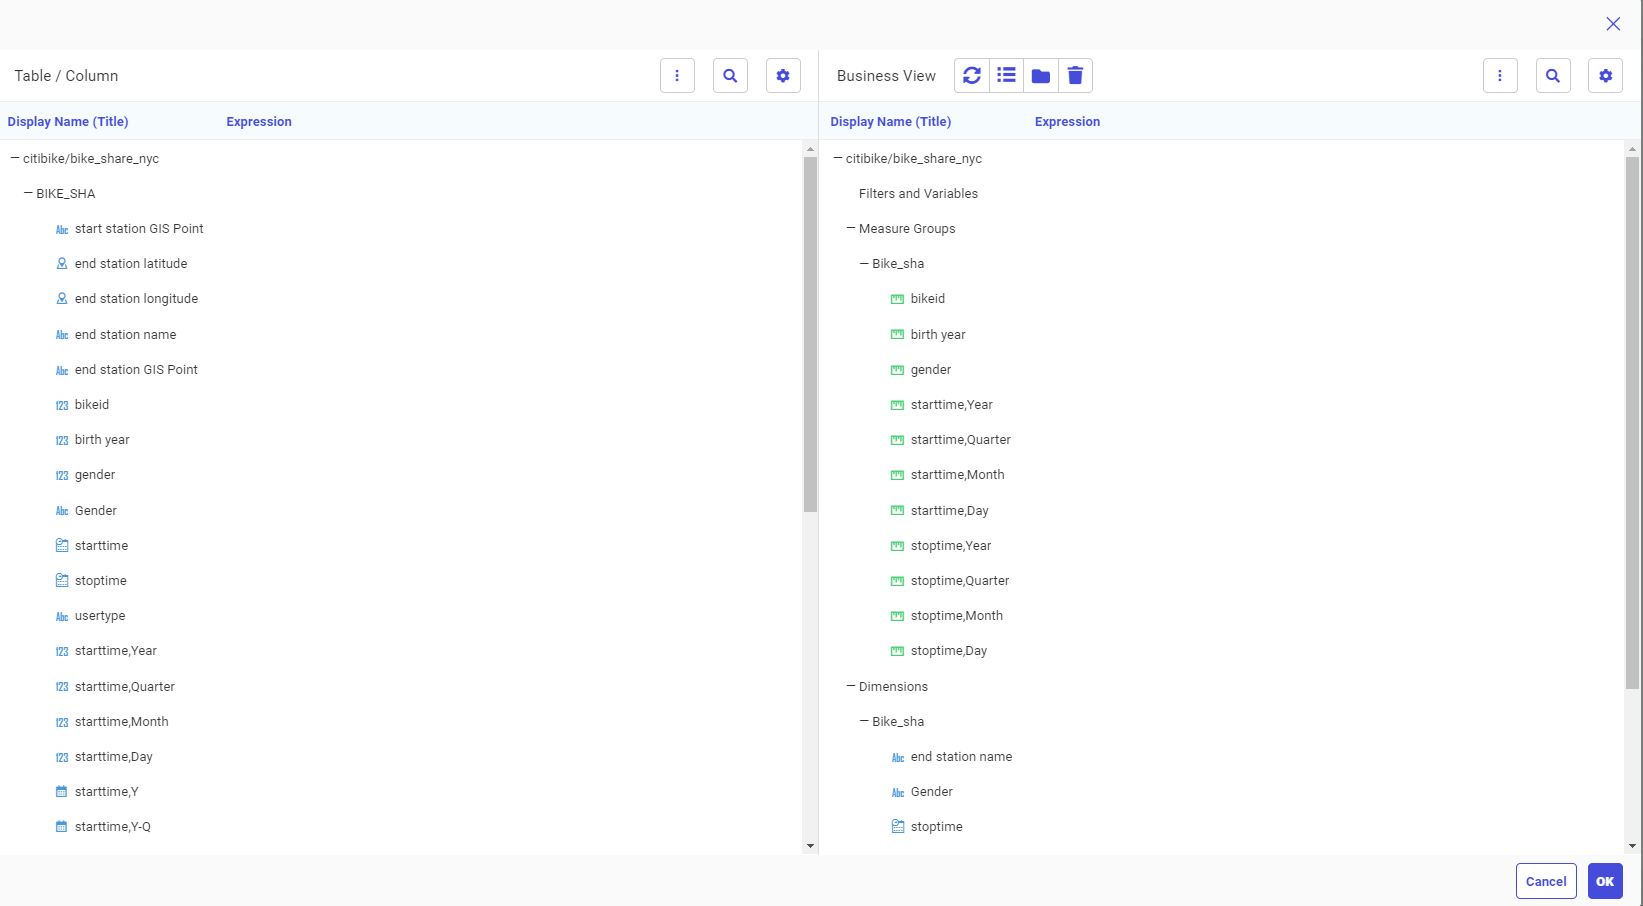
You can create a Business View for the target to categorize the columns into measures and dimensions. This view of the data is used by Designer for creating reports and charts.
Right-click the target and select Edit Business View. A default Business View is created, as shown in the following image.
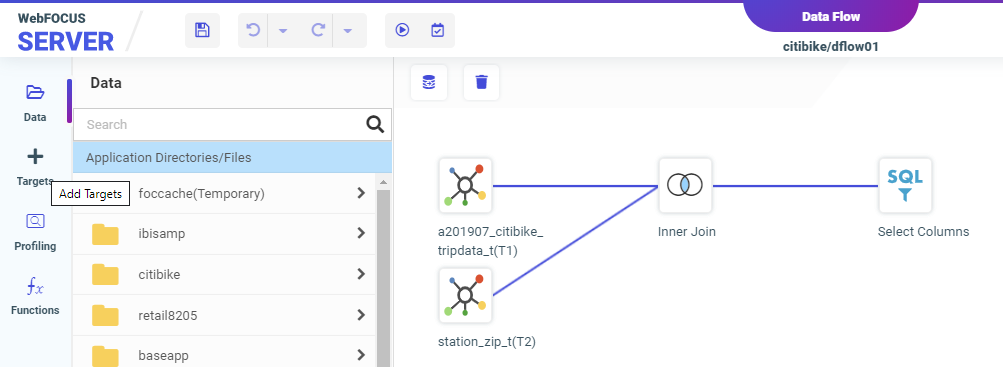
Once a data flow contains all of the fields you need, you can load it to a target data store.
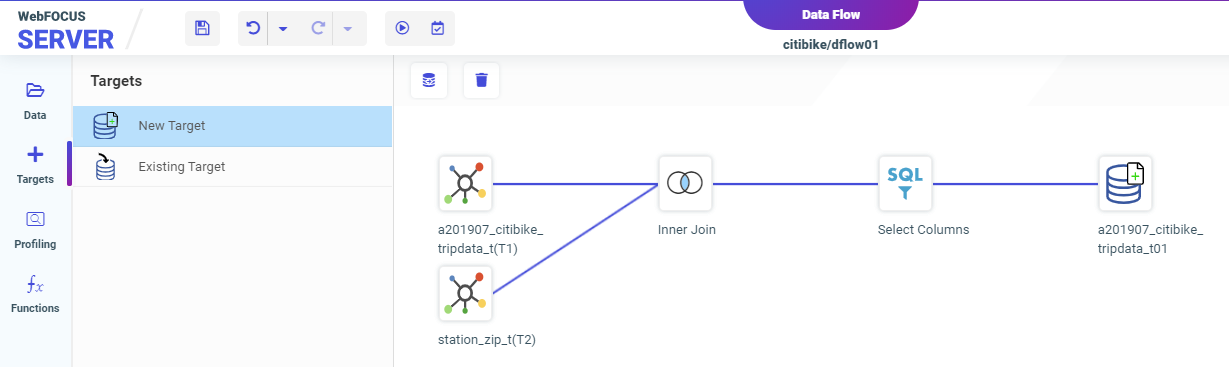
To add a new target:
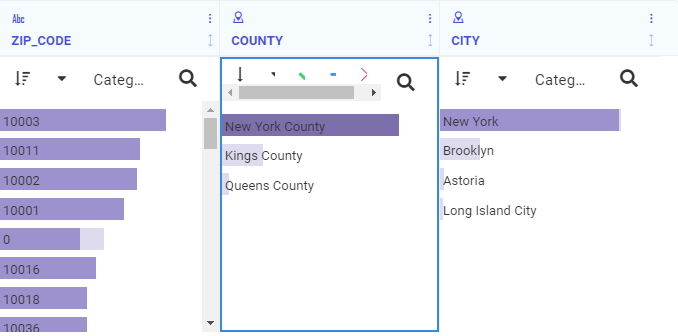
Using Citi Bike trip data, we will restrict our analysis to rides that start in Manhattan, so we can limit the data loaded to just that borough. The geographic data identifies the county, so we will just load the data in New York County.
The display changes to reflect the selection. The dark portions of the bars in each column show the proportion of rows that are selected, as shown in the following image.
The trip data contains station names, IDs, latitudes, and longitudes, but no zip code, city, or county information. To see the zip code and county information, you can download the station station_zip.csv file from http:/techsupport.informationbuilders.com/public/station_zip.csv.
You can add new fields or replace existing fields by creating expressions.
Each filed has a menu icon ( )
)
The menu provides the following options:
You can generate a distribution chart for each column in the flow, which shows a visual image of the field values. The profile chart displays below the field name and shows:
To show the profiling distribution charts:
By default, all fields in a single-segment data source, or all fields from top segment in a multi-segment data source are automatically added to flow. You can turn off this option in the Advanced Options dialog box.
To edit the fields in the flow, right-click the SQL object, and click Edit. The Metadata and Query panes open.
When a data source in a flow has a large volume of data, you can enable sampling for better response time. You can make decisions based on a sample, provided that sample is representative of the entire data set. Data Prep has a built-capability to automatically generate a random sample (with a 99% confidence level and +/- 1% margin of error).
To enable sampling: