Creating Content


Enabling In-Document Analytics Format

In InfoAssist, you can create content, including reports, charts, and dashboards that leverage the interactive capabilities of In-Document Analytics. Enabling this option provides your users with the ability to interact with and modify the content you created for their own analysis.

Note: If you use the Designer style, you will only be able to select the AHTML output format. 

How to Enable In-Document Analytics in InfoAssist

Working with In-Document Analytics Output Formats in InfoMini

As of Release 8206, new output formats have been added to enhance your experience with select self-service products. For example, when working with InfoMini at run time via InfoAssist, you can select an output format for your content. Depending on the options that are enabled in the Administration Console, you may have access to two new formats: HTML Analytic Document (formerly known as AHTML) and PDF Analytic Document (formerly known as APDF).

Integration Points for In-Document Analytics

In-Document Analytics (IDA) provides an interactive interface that allows you to generate real-time, dynamic reports, charts, and dashboards. When working in InfoAssist, you can set the output format to HTML Analytic Document format or PDF Analytic Document format, which will enable you to interact with your content. You can also change options on the Analytic Document Options dialog box. You can use the following integration points to get the full picture of the changes that display as of Release 8206:

Accessing Document Mode

In Document mode, you can:

  • Build a new document.
  • Open an existing document.
  • Generate a new document from an existing single report.

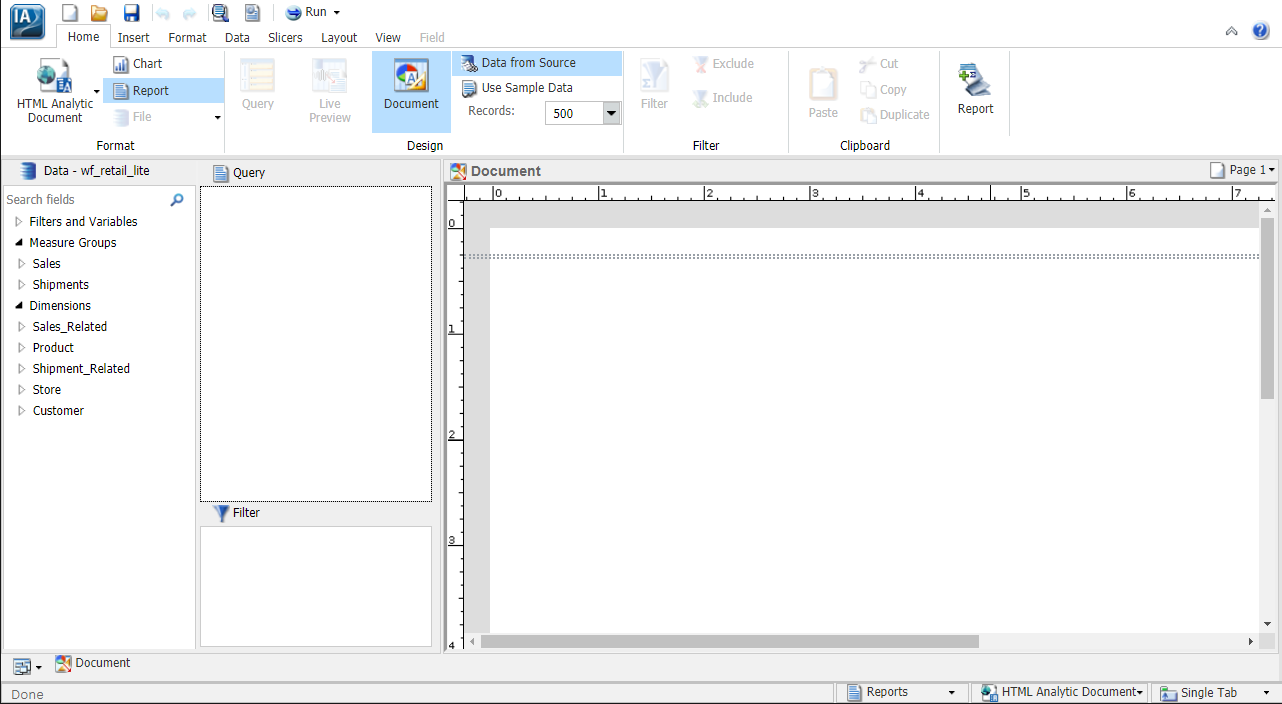
A blank InfoAssist canvas in Document mode is shown in the following image.

Blank InfoAssist Canvas in Document View

Procedure: How to Access Document Mode to Build a New Document

You can build new documents by accessing Document mode from the InfoAssist splash screen.

Creating Customized Report Outputs

You can create customized report outputs in InfoAssist. The standard output formats, which are found in the Format group on the Home tab, include: HTML, HTML Analytic Document, PDF, PDF Analytic Document, Excel, and PowerPoint. For charts, HTML5 is the default output format. For reports, you can also create the following custom report output formats from the Navigation group on the Format tab, including: Table, Table of Contents, Freeze, Pages on Demand, and OLAP.

Creating Reports in the Home Page

You can use the following procedures to create a basic report in the WebFOCUS Home Page and InfoAssist.

Procedure: How to Create a Report

After you have signed in to WebFOCUS, you can work with an existing folder, or create a new folder in the WebFOCUS Home Page to store your reports.

  1. Open InfoAssist in Report mode.
  2. Drag fields onto the canvas or into the Query pane to begin building your report.

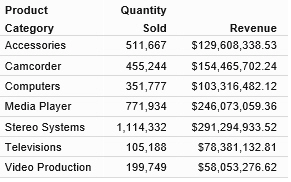
    A basic report is shown in the following image.

    Basic Report