Creating Content


Adding Headings and Footings to a Chart

You can use headers and footers to add key information, such as purpose of the chart and the audience. For example, if you have gross profit for different product categories, you can add a header to highlight this information in your chart.

You can add multiple lines of information into the heading and footing areas in a chart. This accommodates thorough explanations and additional information while offering the most readable presentation.

Using Axis Options in a Chart

Depending on the chart type (for example, bar chart), you can format the axes to customize the display of the information. This includes items such as labels, titles, and font formatting. For example, you can choose to hide the labels in your chart or format the font to add clarity to your chart. You can easily customize the X and Y axis with options that suit your needs.

Formatting Series in a Chart

A series, which is a set of data, represents the set of values for one field in the request (for example, a measure). These numbers are plotted in a chart. You can format the series in your chart, which includes font formatting, display options for labels, and other options, including the ability to hide overlapping labels. Using the Series options, you can select a specific series in a chart to which to apply changes, or you can select All Series, which applies changes to all series in the chart.

Formatting Matrix Charts

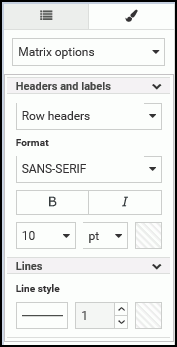
If you are working with a chart type that supports a matrix format (for example, Matrix Marker), WebFOCUS Designer provides a selection of formatting options that you can use to customize and enhance the styling of your chart. A matrix format is a grid that contains values based on the intersecting data points, which is useful for reviewing changes and trends over time. Available formatting options for matrix charts include Headers and labels, and Lines, as shown in the following image.

Formatting Data Grid Charts

A data grid is a type of chart that displays a tabular representation of your data, similar in structure to a tabular report. A data grid allows you to review data in a row and column format, similar to a printed report. Data grids are easy to create, and provide features such as a tooltip for each cell of the grid. WebFOCUS Designer provides numerous options to style and format a data grid.

Values in a data grid can be sorted, and data grids can be shared or saved for use on a page. A data grid is shown in the following image.

Adding a Theme to a Chart

A theme is used to determine the coloring and hues that display in the charts you configure using WebFOCUS Designer. For example, the default border color and chart colors are determined by the theme.

The default theme is called Warm, but you can select a different theme as required. For example, you may want to apply a corporate standard theme to your chart. You can add and change themes to suit your requirements (for example, branding).

Available themes that are called by WebFOCUS Designer are located in the Global Resources domain, as shown in the following image.

Enabling Automatic Content Linking With Auto Linking

Auto Linking makes it easy to connect reports and charts in your development environment, expanding the reporting capabilities of your organization. Using Auto Linking, you can dynamically link HTML5 charts with a single report or chart of any format, based on their common sort (BY) fields and parameters referenced in any filters. It is this commonality that dynamically links content in your WebFOCUS repository, allowing you to discover new possibilities in your data, and explore new relationships within your reporting enterprise.

Using Optional Parameters With Auto Linking to Enhance Drilldown Results

In addition to the basic Auto Linking functionality that is available in WebFOCUS Designer, you can also add optional parameters to your Auto Link charts, extending the capability of this feature. An Auto Link enabled chart can link to any target content that you are authorized to access that satisfies the sort (BY) field to the Auto Link target report filter parameter requirement.

Running an Auto Link Enabled Chart

AutoLink is supported from any WebFOCUS repository content, wherever it is run online.

Example: Launching an AutoLink Enabled Report From the WebFOCUS Home Page

From the WebFOCUS Home Page, right-click a chart that is Auto Link enabled, and then click Run.

Example: Using Hyperlinks to Link to Other Reports or Charts

Use the hyperlinks to link to other reports and charts, based on the following information: