Developing Interactive Content
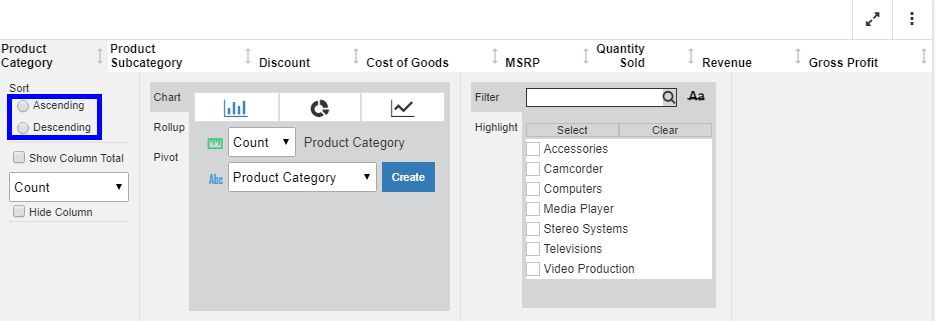
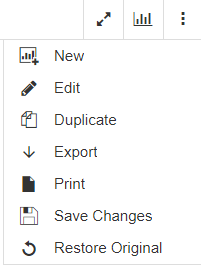
This topic describes how you can develop and enhance interactive content that has enabled In-Document Analytics capabilities.
Interactive Reports
As a developer, you can create effective, useful reports and share them easily using In-Document Analytics for offline analysis.