Visualization and Analytics


Using the Column Menu for Reports

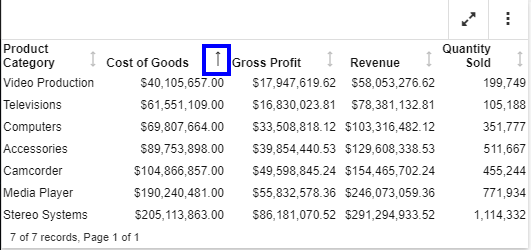
The column menu displays when you click a column heading in a report. This provides you with access to formatting tools, chart type options, and filters, giving you more control over what displays in your report.

For a non-measure or dimension column, there are three primary sections to the column menu, as shown in the following image.
 

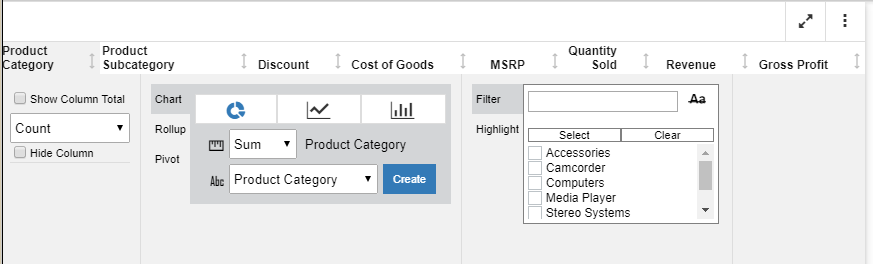
For measures, there are two additional options:

Using Sort Column Indicators to Control the Display of Information in Your Report

Interactive reports support the use of sort column indicators when you want to sort data in a report. You can sort a column in ascending and descending order, giving you control over the display of information in your report. The indicator that shows how a column has been adjusted by a previous action shows to the right of the column, as shown in the following image.

In-Document Analytics Options for Reports (Cell Menu)

You can use a variety of menus and options when performing analysis of an interactive report that uses In-Document Analytics. Depending on the style that you use, these options may be different.

Using the Designer Style interactive report, the cell menu allows you to customize the display of your report, while adding the ability to quickly add filters. The cell menu displays when you click on each cell in a report. This enables you to highlight an individual value or a row. You can also reverse a previously highlighted aspect. The cell menu is shown in the following image.

Using the Vertical Ellipsis Menu to Perform Common Tasks

When working with interactive content that uses the Designer style of In-Document Analytics, the vertical ellipsis menu contains the most commonly used features. For example, you can easily create a new report or chart from this menu.

The vertical ellipsis menu is located at the top-right of the user interface, and is indicated by stacked black dots, as shown in the following image.

When the vertical ellipsis menu is expanded, the following items display:

Overview of In-Document Analytics (8206)

Content that uses In-Document Analytics provides users with an interactive interface that allows the generation of real-time, dynamic reports, charts, and dashboards.  Its versatility allows you to package a data set with a combination of analytical views, resulting in highly intuitive and interactive self-service business intelligence. This gives you an edge in presentation and analysis, making it easy to develop and share concepts, ideas, and scenarios. An interactive report is a self-contained report, meaning that it contains all the data and JavaScript® within the HTML output file.