Visualizing Data


Creating Gauge Charts

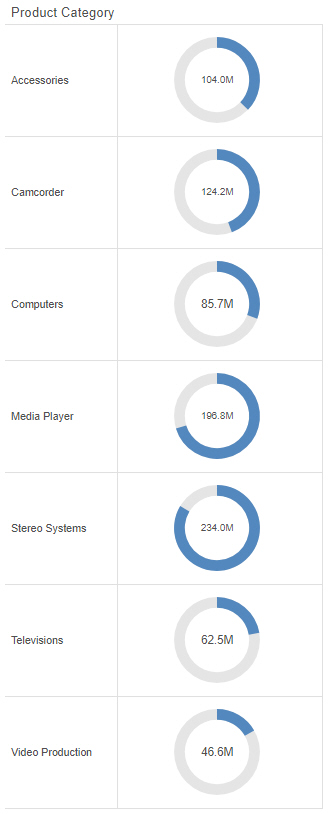
A gauge is a simple visual that shows a measure value. These can be used to create straightforward KPI graphics, or use matrix rows and columns to compare data for different sort values. The following example shows a gauge chart with matrix rows.


matrix gauge chart

The following display options are available for a gauge chart:

Creating Waterfall Charts

Waterfall charts allow you to see incremental positive and negative changes in your data, resulting in a rolling total. Positive and negative values are represented by different colored risers that start at the end point of the previous riser. Waterfall charts can be a good way to show change over time. An example of a waterfall chart is shown in the following image.


waterfall chart

The following display options are available for a waterfall chart:

Video: How to Pass Parameter Values to a Page Using Drill-Down Links

You can use parameterized drilldowns to connect to a page in your repository. Whereas in InfoAssist you must use a URL to drill to the page, when you create charts and reports in WebFOCUS Designer, you can simply select the page that you want to drill to using a file picker. The value that you click or select in your content can be passed to the page as a parameter. The page opens with your selections already applied as filter values, creating a seamless transition between content items. 

Creating HTML5 Charts With WebFOCUS Language

This content explains how to use the JavaScript® Chart Engine (Js:Chart). Js:Chart draws a chart in an HTML environment using a defined data set and JavaScript® Object Notation (JSON) definitions. The JSON object(s) define chart properties that control the appearance of the chart and chart objects.

Creating HTML5 Charts With TIBCO WebFOCUS® Language PDF

This content explains how to use the JavaScript® Chart Engine (Js:Chart). Js:Chart draws a chart in an HTML environment using a defined data set and JavaScript® Object Notation (JSON) definitions. The JSON object(s) define chart properties that control the appearance of the chart and chart objects.

Video: How to Create Analytical Dashboards for Use on Mobile Devices

Adaptive Dashboard provides a mobile view with a fixed layout that will make the dashboard easier to use while navigating on mobile devices. You can use a number of filters, so keep these in mind, as we will discuss them in more detail a little bit later.

You can enable the Adaptive Dashboard option on new or existing In-Document Analytic documents in InfoAssist by clicking the Adaptive Dashboard button on the Layout tab of the ribbon, under the Page Setup group.

Generating a Data Extract or Image From Content

In addition to the output formats that you can use when running your content, you can export a snapshot of a single chart or report as a data extract in an Excel spreadsheet, or as a .png image, which are downloaded from your browser. This allows you to quickly generate a representation of your content at any time, in a format that can be easily saved and distributed.

To generate the image or data extract, click the Application menu and, in the Export As section, click Data or Image. The file is downloaded using your browser.

Adding Drill-Down Links to Content

Drilldowns are a powerful feature that allows users to navigate from one content item to another, providing access to additional, related information at run-time. Drill-down links can also be used to pass parameters, so that the target content is automatically filtered for the value that a user selects, allowing you to maintain context between items. By linking content with drilldowns, you can vastly expand the amount of information that is available from a single chart or report.

Chaining Filter Control Selections

When a content item or page includes multiple filters, chaining ensures that those filters always return valid values to your content. When you select a value from one of the filter controls, the other controls can be filter and updated based on the value that you select, if chaining is applied. For example if you have a filter for Sale Quarter chained to a filter for Sale Month, then when you select Q1 from the Sale Quarter filter, the Sale Month filter updates to show only the months of January, February, and March, and automatically excludes any month values that were not in Q1.