Visualizing Data


Video: How to Add Static Filters to Your Content

Filters allow you to limit the data that displays in your content to show only the information that is important or relevant to you.  You can create prompted filters, whose values can be selected at run-time, and static filters, which always apply the same value, allowing you to set consistent filter values to your content.
To create a static filter, drag the field that you want to select filter values for to the Filters bucket. You can filter for any field in your data, regardless of whether or not it is used in your content.

Video: How to Use Insight to Analyze Dynamic Charts

Insight allows you to make significant modifications to your content at run-time, and can be enabled with the click of a button.
Insight allows you to completely transform a chart at run-time. Enabling Insight just takes a single click of a button: once you’ve created a chart, just click Run with Insight in the Content area of the Settings tab.  You can enable Insight for stand-alone charts only. On the toolbar, click Preview to begin making your selections.

Video: How to Use Dynamic Grouping for Dimension Field Values

Dynamic grouping allows you to group related dimension values in your data into useful categories.
If your data includes values that it might be useful to combine, you can add them all to a group in a new grouped field. For example, the data in this pie chart might make more sense if the subregions in the United States were grouped together.  By grouping your data into useful categories, it becomes more manageable, better organized, and ultimately, more useful. 

Video: How to Create Charts

Hello, and welcome to this video on Creating Charts. Using WebFOCUS Designer, you can create a wide variety of charts, which enable you to convey information in intuitive visual formats that make an immediate impact. 
You can add multiple charts of different types and with different fields to a visualization.  This lets you take advantage of the flexibility of the chart feature while meeting your needs for presentation, format, and portability.
To create a chart in a visualization, on the WebFOCUS Home Page, click Visualize Data. 

User's Guide PDF

TIBCO WebFOCUS® is the reporting engine that turns corporate data into meaningful information. It enables any executive, manager, analyst, employee, partner, or customer to execute smarter decision-making. The platform delivers many rich new capabilities and integrates the four critical elements that any enterprise needs: business intelligence, performance management, advanced analytics, and data integrity.

This content includes topics to to help you connect to and edit data, author reports and visualizations, perform predictive and location analytics, build applications, run and schedule procedures, share your data, and more. 

Configuring Basemaps and Layers

You can edit an existing basemap definition or add a custom basemap.

Using Standard Basemaps

To add a new basemap or customize an existing basemap, select Basemap from the Object drop-down list.

Configuring Basemap Properties

The following is a description of the properties used for basemap configuration.

name

Is the name of the basemap.

Next to the name is an indicator of whether the basemap is a standard basemap or a customized basemap.

Using the Data Tab

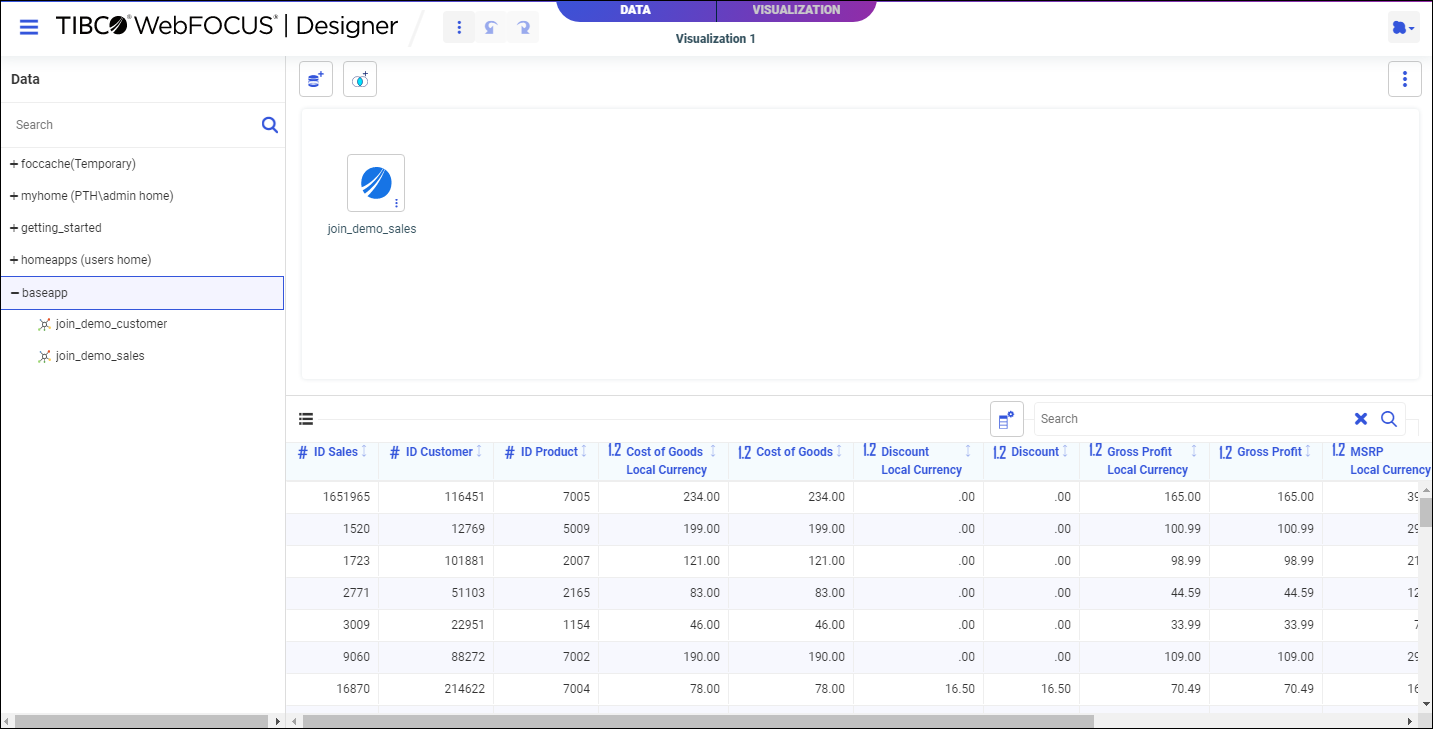
To access the Data tab, select DATA on the WebFOCUS Designer toolbar.

The WebFOCUS Designer Data tab with a single synonym on the canvas is shown in the following image.


The Data tab includes the following tools and components.

Applying Themes to Portals

You can apply themes to a WebFOCUS portal to customize its look and feel. Themes can be applied to new portals inside the New Portal dialog box or to existing portals inside the Edit Portal dialog box. A theme affects the look of the entire set of elements of the portal, including colors, opacity, and typeface styles.

There are four themes that WebFOCUS offers:

Adding a Custom Geographic Role

The GEO configuration editor in the WebFOCUS Server provides a tool for editing or adding properties for geographic roles.

On the WebFOCUS start page, from the Management Center, click Server Workspaces to access the WebFOCUS Reporting Server Workspace area. Alternatively, from the WebFOCUS Home Page, click the Settings menu and click WebFOCUS Server. When the WebFOCUS Reporting Server browser interface opens, open the Tools menu and click Workspace. The Workspace area opens.

User Options in Phone Mode

You have a number of options in Phone mode, including robust filtering and hover capabilities.

Filtering

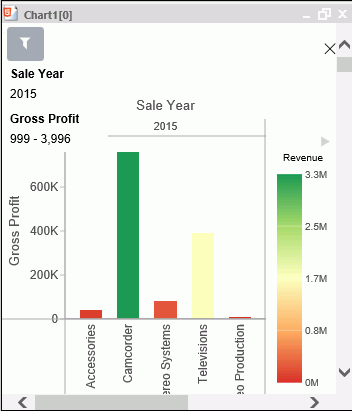
In Phone mode, you can filter just like in regular desktop mode. The primary difference is that the filter shelf stacks the available filters in a vertical row, as shown in the following image.