WebFOCUS Designer


Using the Variables Tab

The Variables tab contains a set of predefined parameters that you can use to add information to the chart header or footer, build dynamic calculated fields, or quickly create filters based on conditions defined in the data source.

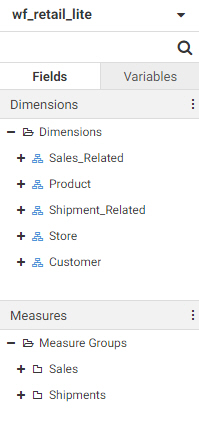
The available variables are divided into two sections, System Variables and Query Variables, as shown in the following image.

Variables tab

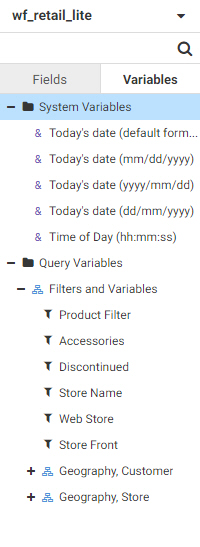
System Variables are predefined variables that are always available for use. These are:

Using the Fields Tab

The fields in your data source are available from the Fields tab. By default, if the data source uses folders to organize the fields that it contains, these folders are reflected in the Fields tab. This folder organization is called a business view. For dimension fields, these folders could be field hierarchies defined in the data source or segments in the data based on different tables that have been joined together. Measures can also be grouped based on segments.

Exploring Chart Creation Options

WebFOCUS Designer enables you to quickly and easily create many different types of charts. You can build charts that use filters, matrix rows and columns, calculated fields, include run-time behavior such as Insight and Auto Drill, and many other customizable features. These charts can be added to a page or workbook with other charts to provide an expanded view of your data.

Exploring and Modifying Retail Samples Content Using WebFOCUS Designer

To explore and modify Retail Samples content using WebFOCUS Designer, open one of the subfolders in the Designer folder (for example, Product). Right-click on a chart (for example, Units By Product YTD) and select Edit from the context menu, as shown in the following image.

Edit context menu

The selected chart opens in WebFOCUS Designer, as shown in the following image.

Using Retail Samples

A sample WebFOCUS domain called Retail Samples is included in your environment to help you quickly get started. The Retails Samples domain allows you to explore sample data, sample content that was created using WebFOCUS Designer, and quickly develop new content.

Retail samples domain

The Retail Samples domain includes the following folders containing sample content, which you can access:

Exploring Data Discovery Options

WebFOCUS Designer provides the ability to create a data flow. You can join data sources based on shared fields to enhance the data available to you. You can then create a chart based on the enhanced data source.

You can only create a data flow when your data source is a Master File. Data flows are unavailable when creating content from a Reporting Object.

Video: Getting Started With WebFOCUS Designer

WebFOCUS Designer is a web-based development platform that you can use to quickly and easily create content from your data. WebFOCUS Designer enables you to manage your data using data flows and use that data to create charts, interactive and responsive pages, and workbooks. With WebFOCUS Designer, you can go from data discovery to content creation to content integration and application development all in a single tool, quickly and easily sharing your insights with others.