WebFOCUS Home Page


Pivoting Data Columns Into Rows

Some data files may contain repeating columns, such as sales figures for a series of years. There may even be repeating column groups, such as both budget and actual figures for a series of years.

When a data source includes multiple measure columns that provide values for the same type of measurement, it may be useful to pivot these columns into rows. This results in a simpler table with fewer columns, and with more dimension fields for sorting your data.

Creating Synonyms

During the Connect to Data workflow, you can create Base or Cluster Synonyms of your data. A Cluster Synonym is made up of multiple tables that are connected by Joins. You can choose to enhance your synonym when initially you create it, by modifying field names, assigning geographic roles, creating expressions, and more, or you can edit it at a later time. 

Procedure: How to Create a Synonym

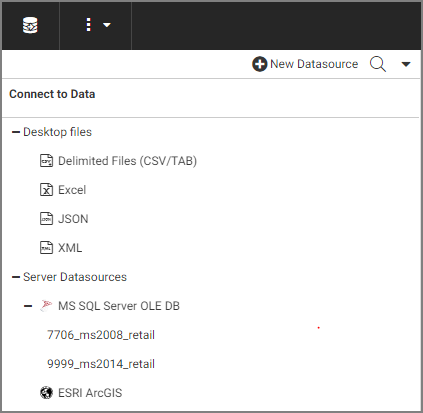
  1. In the Connect to Data panel, under Server Datasources, right-click a configured adapter.

    A shortcut menu opens, as shown in the following image.

Configuring Adapters

The Connect to Data workflow creates a connection to your data, which will allow you to modify your data for use in WebFOCUS. You can configure a new adapter or connection, add a connection to an existing adapter, or change adapter connections.

The initial Connect to Data screen displays a panel for selecting or configuring adapters, and also for uploading data, as shown in the following image:

Connecting to Data Sources

You can configure adapters and connect to data sources across your enterprise, which you can then use to build reports, charts, and visualizations using WebFOCUS Designer or other tools. You can also create a synonym for one or more data objects, or create cluster synonyms for select objects assigned as facts or dimensions.

You can access the connect to data workflow in the following ways:

Joining Data in WebFOCUS Designer

In WebFOCUS Designer, you can Join data when creating a Chart or Workbook, and create new content from your joined data.

The joined data structure is used when WebFOCUS runs the Chart or Workbook, and is not applied permanently to the metadata. This allows you to virtually join multiple data sources as if they were a single data source, from which you can report in a single request. This can increase the number of relevant fields available for use in your content, giving you an expanded selection of data specific to your charting purposes. 

Accessing Folder and Item Properties

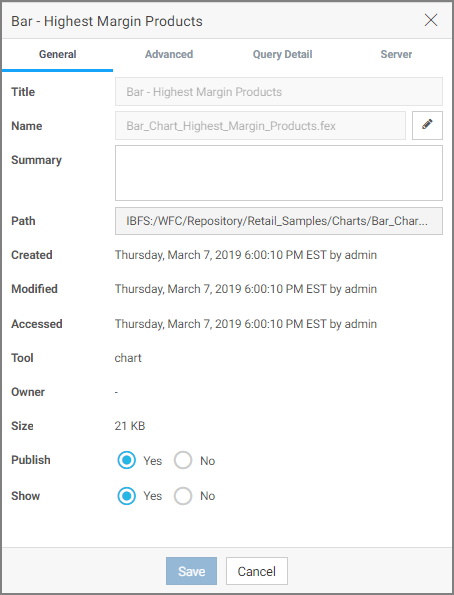
On the WebFOCUS Home Page, authorized users can select the Properties option to review information about a folder or item, including when it was created, the date it was last modified, title, name, and settings that control the Reporting Server and applications it will access. There are also settings that control the functionality available to users when they access the folder, run, or schedule an item.

The following image shows the Properties panel for a stacked bar chart.

Using Favorites

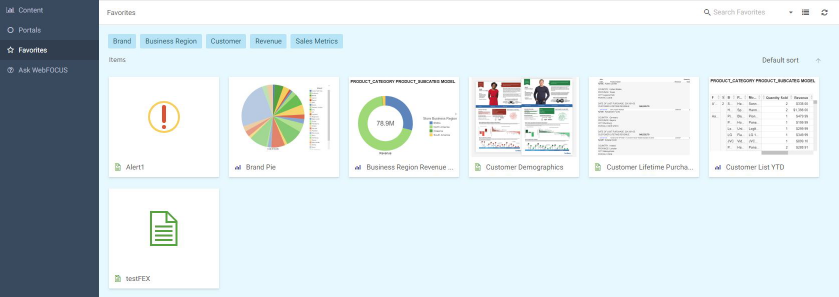
You can further customize your Home Page by using the Favorites feature. Favorites can be reports, graphs, hyperlinks, Reporting Objects, and other item types. The Favorites feature provides a convenient and fast way to find and use your favorite content, without having to search for it. You can interact with your favorite content and view its properties, and also access Favorites from a mobile device.

From the Home Page, Favorites appear in the Favorites view, as shown in the following image.

Video: How to Use Favorites

You can customize your Home Page by using Favorites. 

The Favorites feature provides a convenient and fast way to find and use your favorite content, without having to search for it.

From the Home Page, Favorites appear in the Favorites view.
    
From the Legacy Home Page, Favorites appear in the Resources tree.

Favorites can be reports, graphs, hyperlinks, Reporting Objects, and other item types. 

You can add items to Favorites from any domain or folder if you have permission to do so. 

Video: How to Access Web Content and Global Resources

In the WebFOCUS Home Page, you can create new content, such as charts, reports, visualizations, pages, and schedules, in the Domains area.  However, you can also access the Web Content and Global Resources folders.  These folders allow you toquickly and easily access content saved outside your WebFOCUS Repository.

The Web Content folder lists applications that are located on the WebFOCUS Client. 

Video: How to Use Search Options in the WebFOCUS Home Page

You can use advanced search options in the WebFOCUS Home Page to make your searches more precise in order to find the content that you want more quickly.

To access advanced search options, click the down arrow at the right of the search field.  You can specify the area where your search term appears, the type of file that you are searching for, and the matching behavior for the search term.