WebFOCUS 8207.13 Release Notes
The following topic provides all the information that you need to know about this release of WebFOCUS.
- Release and Gen Information
- New Features
- Fixes
- Upgrade Notes
- Known Issues
- Browser Information
- Release Information
- WebFOCUS Accessibility Compliance
Have questions? Click Send Us Feedback (on the right) and we'll be in touch!
Release and Gen Information
| Release Date | Gen Information | Reporting Server |
|---|---|---|
| Friday, July 10, 2020 |
wf070820a Gen 15 wi070820a as070820a |
8207.13 Gen 1918 |
New Features
Automated Insights
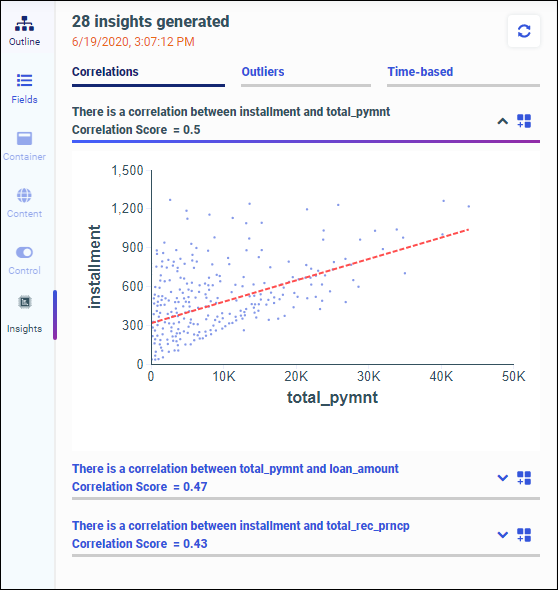
Using Automated Insights in WebFOCUS Designer, available in Trial and Product versions, you can now easily run advanced analyses and generate visualizations and narratives on your data sets. You do not need to manually prepare and analyze your data, or have prior knowledge of data science or statistics. Automated Insights is available for use on-premises and in the WebFOCUS Cloud Trial.
With one click, Automated Insights recognizes the trends in your data, generates customizable visualizations as charts with natural language headers, and categorizes the charts into tabs. You can add these charts to the Designer canvas and build a page, or add them to existing pages or dashboards. Then you can save and share your insights with others.
Creating Statistical Box Plots in WebFOCUS Designer
A box plot, also known as a box-and-whisker plot, is a chart type that is commonly used to display distribution information about your data. Box plots provide numerous key data points for multiple dimension values, allowing you to quickly compare the range, skewness, and dispersion of each one. The box represents the range between the upper and lower quartiles, and the line inside the box represents the median. The whiskers represent the maximum and minimum with outliers excluded, and outliers are represented by individual points. An example of a box plot is shown in the following image.
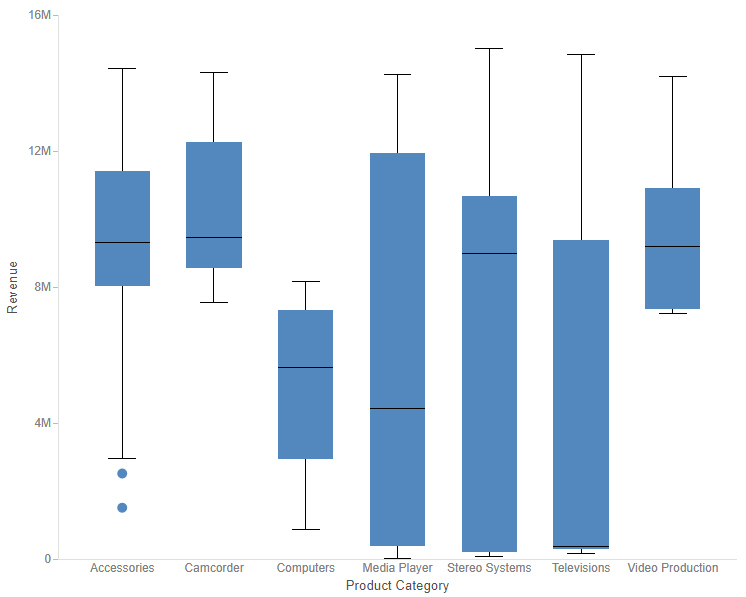
To create a box plot, add a measure to the Vertical bucket and a dimension to the Horizontal bucket, then either use the Detail (PRINT) calculation method or add a dimension to the Detail bucket to provide individual values to the data set for which the box plot is generated.
Creating Simple KPI Visuals
You can create KPI visuals to display simple metrics in a straightforward manner, without extra styling or graphics. These allow you to clearly communicate the values of key metrics in a format that can be easily added to a page with other content items. An example of a KPI chart is shown in the following image.

To create a KPI chart, select the Gauge chart type from the Content picker, and then, from the display options, select the KPI gauge type, as shown in the following image.

You can style the text in a KPI chart or in one of the other gauge chart types by selecting Gauge Properties on the Format tab. These properties include the option to show and position the field name along with the measure value, and change the font, size, and color of both.
Representative Sample Data in WebFOCUS Designer
When you create charts, reports, and pages in WebFOCUS Designer, the canvas displays a design-time preview of your content. By default, the preview uses a subset of the data available in your selected data source, reducing the resource usage required in running a full data set, while still providing a representative and useful preview of your content.
You can now use a representative sample of the values in your data source to generate the preview in the WebFOCUS Designer canvas. The size of this sample is based on the number of records required to achieve a 99% confidence level. Previously, the preview data sample was always taken from the start of your data source. For example, if you used a record limit of 500, the first 500 records from the data source were used. This meant that, in certain data sources, the preview may not have represented the content as it would display when using the full data set at run time. With a representative data sample, the design-time preview better reflects the distribution of values in the full data source, while still significantly reducing resource usage.
The representative sample option is now the default sample data setting. To change this setting to show the first records in the data source, or to use placeholder test values, click the data settings button on the Visualization toolbar. The Canvas Data Limit dialog box opens, as shown in the following image.
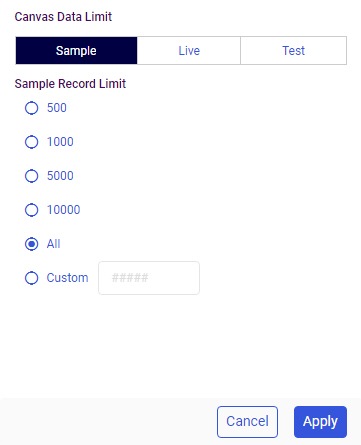
You can change the type of sample, the number of records used, and, when using values from the start of your data source, whether the record limit is applied at the data source level or after records have been retrieved for the request. When you create a page from new content, you can also choose to apply the sample at run time, if you think it is an effective reflection of the full data set.
Displaying Date and Date-Time Fields on a Continuous Axis
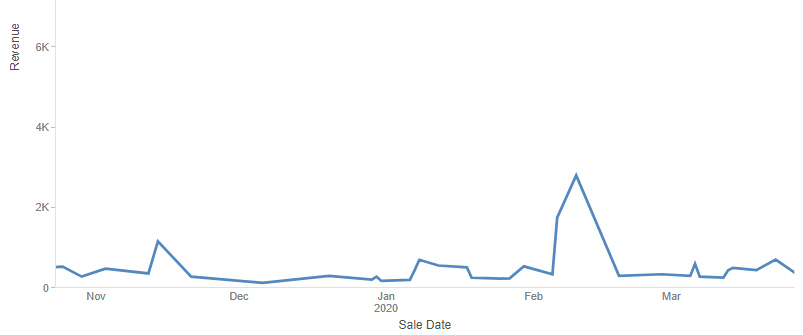
In line and area charts created in WebFOCUS Designer, date and date-time fields on a dimensional axis are now displayed, by default, as a continuous range instead of discrete values. When this option, called the time axis, is enabled, missing values within the date range are extrapolated based on the nearest values. This allows you to see changes in your data over time on a continuous scale, displaying date values more intuitively and making it easier to recognize gaps in your data.
When the time axis option is enabled, the values in the chart are plotted along a continuous date axis, as shown in the following image.
The same chart with the time axis option disabled is shown in the following image. Only dates with values in the data set of the chart display. Since not all dates appear in the chart, each existing date value is labeled on the axis.
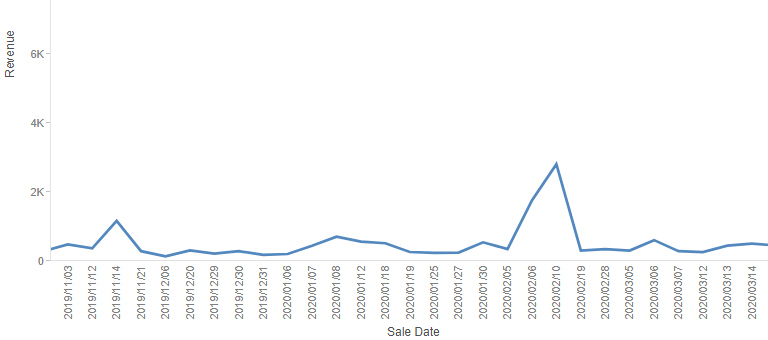
To disable the time axis option and show only the date values in your data source, right-click the date or date-time field in the Horizontal or Vertical bucket of your chart and deselect Time axis.
To re-enable the time axis option, right-click the date or date-time field and click Time axis again.
Adding Trend Lines to Charts in WebFOCUS Designer
When creating bar, line, area, or scatter plot charts, you can apply trend lines to a series to more easily recognize and visualize the patterns in your data. You can choose from a number of different trend line calculation equations, including linear, parabolic, logarithmic, or even polynomial equations for which you can specify the degree.
To add trend lines to your chart, create a bar, line, area, or scatter plot chart and, on the Format tab, select Series from the quick access menu. Select a series for which to draw a trend line, or leave All selected to generate a global trend line for the entire chart, then, under the Trend Lines section, select the Show trend line check box. Trend lines use the series color by default, but you can specify a different color, line style, and line thickness for each one. You can also select from the following trend line equation types:
- Linear
- Logarithmic
- Exponential
- Polynomial
- Geometric
- Hyperbolic
- Log Quadratic
- Modified Exponential
- Modified Hyperbolic
- Quadratic
- Rational
If you select the Polynomial option, you can use the Order menu to set the degree of the polynomial equation.
Trend lines appear, representing the data patterns of each series for which they were enabled, as shown in the following image.

Exporting a Page as a PDF or Image
You can instantly download a snapshot of your page as a PDF document or .png image using the Export to file menu on the page toolbar. This allows you and anyone running the page to quickly capture its current state, with filter selections applied, in a format that can be easily reused, distributed, added to PowerPoint presentations, and more.
When designing or running the page, the Export to file menu appears on the page toolbar by default. Click it to display options to download a snapshot of the page as a PDF or image, as shown in the following image.
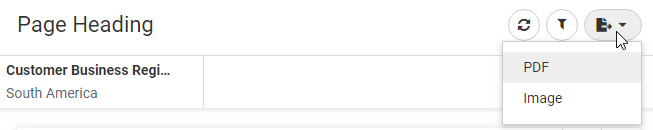
The .pdf or .png file is downloaded using your browser. The file can be opened immediately and saved to distribute and reuse later.
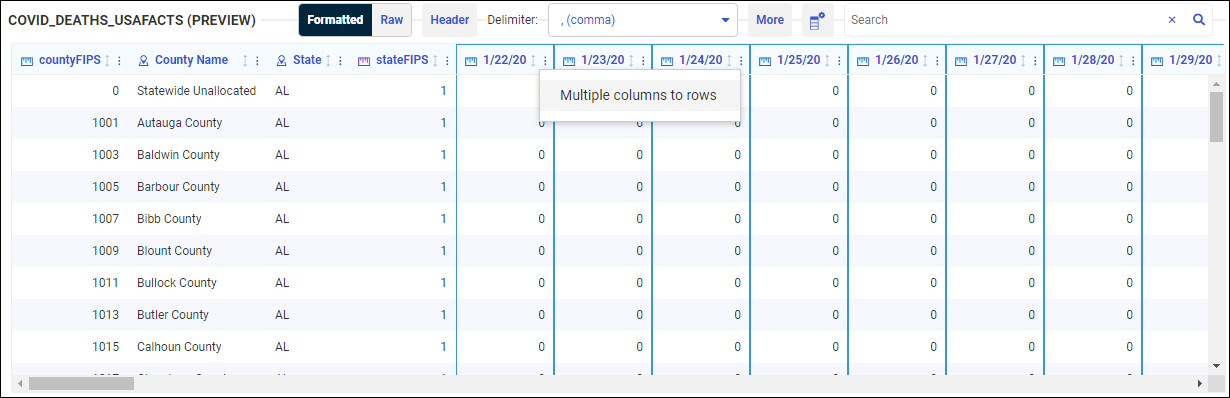
Pivoting Columns with Date Headers
If pivoting an uploaded data file with multiple repeating columns into rows, and the column headers are dates, the fields are now recognized as date values, so you can report from the table using date functions.
Creating a Synonym in a Data Flow Using Variables for the Existing Excel File Name
Using the Data Management Console (DMC), you can now create a synonym in a flow for an existing Excel target using variables for the data file name, as shown in the following image.
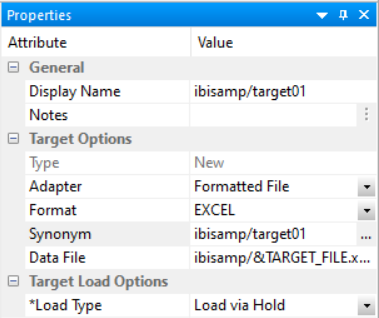
The Formatted File adapter is used with the format EXCEL.
While the Excel file must exist prior to running the flow, the synonym does not have to exist prior to running the flow.
For more information, see the WebFOCUS Release Notes PDF.
Displaying Messages at the Top of the Load Options Screen
When you edit the load options for a data flow, error messages, if there are any, are now displayed in red on the top of the screen where they can more easily be seen, as shown in the following image.
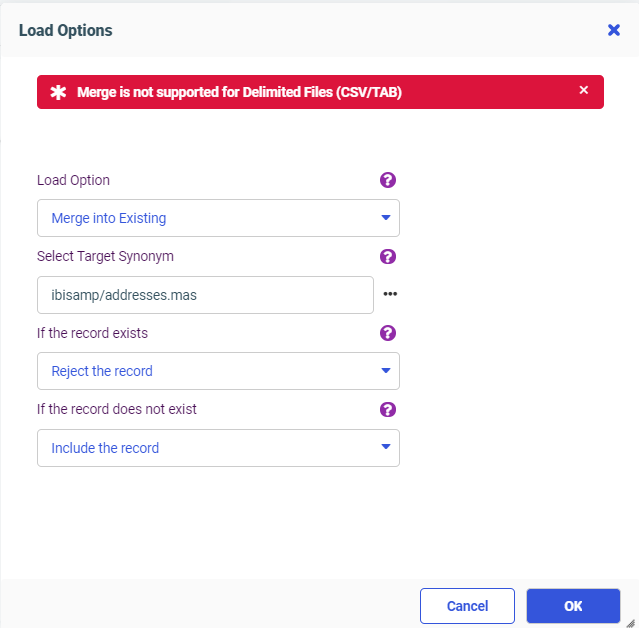
When you correct the problems, the messages disappear.
Key Analysis Using Sample Data
he Key Analysis report helps you select one or more fields that uniquely identify each record in a data set, so that these fields can be used as the key when loading the data to a relational database table.
Using Key Analysis, you select a synonym and then select fields that you think may be good candidates to become key fields. The server will then evaluate the fields, separately and in groups of two, three, and so on, to generate statistics that enable you to select an optimal set of key fields.
While using the entire data set ensures total accuracy in determining the uniqueness of the fields, for large data sets this could take a long time to process. Therefore, if you enable sampling in your Web Console preferences, a representative sample of the data will be used, enhancing performance while providing a reasonable assessment of the uniqueness of the selected fields.
After determining which fields should be key fields using the sample, rerun the analysis for those fields using the full set of data, in order to be sure that they uniquely identify each row.
The Key Analysis report is most useful when run against a data set that does not already have keys defined in the metadata. Most relational tables already have key definitions.
For more information, see the WebFOCUS Release Notes PDF.
Adapter for Oracle: Support for Instant Client Basic Package
The Adapter for Oracle can now be configured to work with the Oracle Instant Client Basic package, in addition to the Database Client supported in prior releases.
Adapter for OData: Starting Retrieval With the Child Object in a Static Join
The Adapter for OData can now access data directly from a Related Entity rather than using the $expand parameter in the OData request.
A related Entity is described in the Master File as a child segment of the parent.
Add the following attribute in the child segment definition of the Access file to create an OData request directly against the defined Entity, assuming all requested fields are from that child segment.
ENTITY_SET=entityname
where:
- entityname
-
Is the name of the Related Entity.
Fixes
- Radio buttons typically do not use the ID attribute of the object and use the name instead, however, if custom JavaScript makes use of the ID, it will not work. (200612010)
- When an HTML Canvas page loads, the window_onload() function is called after the UpdateData() call and now requires the use of onInitialUpdate(). (200612011)
- A page is loaded before and after translations when the page contains Multilanguage. (200612007)
- Creating a Data Flow with a subquery attempting to add a WHERE condition to the final SELECT statement results in an FOC003 error. (200401067)
- Invalid JSON is sent in the body of the POST request based on an authentication Master defined by chained authentication.
- A Multiple select listbox is not populating an existing single parameter with "OR". (200611030)
- When an ARVERSION=2 request returns a large recordset, it is taking an excessive amount of time to display the content. The more unique the dataset the worse the performance.
- When an ODBC connector is unable to connect to a data source, a terse error message is displayed which does not aid in problem determination: {{[IBI][EDA] 'NG failed to load}}
Upgrade Notes
- When upgrading from release 8206.xx to 8207.xx, the WebFOCUS Integrated Installation does not automatically assign the Unicode UTF-8 (CP65001) code page to the Reporting Server configuration. In order to configure the Reporting Server to use the UTF-8 code page, you can select the entry directly from the CODE_PAGE? list. In the Web Server console, this list appears in the NLS Configuration tab of the Workspace node.
We recommend that you apply this change because, as of release 8207, WebFOCUS Integrated Installations configure all installed components to use the UTF-8 code page. Changing the Reporting Server code page to UTF-8 will ensure that there is no mismatch of code pages between WebFOCUS, Tomcat, and the Reporting Server, which could result in data retrieval issues. - In Release 8207, Magnify functionality is not available. To add Magnify functionality to Release 8207 and higher, see the manual steps outlined in this topic.
- As of Release 8207, in App Studio, the Domains node in the Configured Environments tree has been renamed to the Workspaces node.
- The WebFOCUS Server on Linux using the Adapter for salesforce.com now requires using OpenSSL version 1.1.1. While current distributions include this release older ones do not.
This software can be downloaded from https://www.openssl.org/source/ and it must be compiled with the shared option.
Ater this, create symbolic links to the required libraries. For example, if the directory used was /usr/local/ssl, issue the following commands:
sudo ln -sf /usr/local/ssl/lib/libssl.so.1.1 /usr/lib64/libssl.so
sudo ln -sf /usr/local/ssl/lib/libcrypto.so.1.1 /usr/lib64/
libcrypto.so
Known Issues
- The WebFOCUS help system does not work when the Application Server is configured with Java Version 11. As a workaround, you can configure your WebFOCUS instance to use help hosted by IBI. This provides an additional benefit, as users will have access to the latest content. See the workaround in the Release Notes PDF.
- The canvas of WebFOCUS Designer for this release is an interactive canvas based on AHTML. When creating a report, page and row break settings are not supported on this canvas for this release. If you select any other output format, such as HTML, PDF, PPTX, or XLSX, you will see these breaks at runtime. These output format options are available for stand-alone content items only. This will be resolved with the introduction of the non-interactive document canvas in a future release.
- When an Insight-enabled chart created in the 8207.00 version of WebFOCUS Designer is added to a visualization as external content, the Insight icon does not appear on the chart when the page is run, so Insight features cannot be accessed. Resave the chart in WebFOCUS Designer 8207.01 or later to make Insight available when the chart is added to a visualization.
- When working with the Cell menu in an interactive report, the filtering functionality does not work as expected.
- When saving an artifact (from or of and interactive report, chart or dashboard), the output file name is ARsave.html rather than ARhtml.html.
- If you create a report or chart in ARVERSION=2 (In-Document Analytics) and you set the output format to PDF Analytic Document, an error occurs when you run it. If you change the option in Procedure Settings to Legacy, the report or chart is produced correctly.
- If you are working with an In-Document Analytics chart in landscape mode on an Android mobile device and you switch to portrait mode, your content displays in fullscreen mode. Your chart displays at the bottom. If you run your content in new window mode, your In- Document Analytics chart does not display in fullscreen mode, displaying the chart on the right.
- HIDENULLACRS, which hides across columns that have null or zero values in the entire column, is not supported with interactive content using the new Designer style of In- Document Analytics capabilities.
- If you add an existing ARVERSION=1 report to an AHTML document set to ARVERSION=2, it fails at run time, displaying JSON text on the screen instead of the expected report output.
- If you are working with a procedure (.fex) and you change the ARVERSION to ARVERSION=2, global filters do not display when you run the procedure.
- In a scatter plot chart or bubble chart, multiple measure fields on the horizontal and vertical axes generate separate axes, resulting in a grid of scatter plots for each combination of measure fields. In WebFOCUS Designer, if you create a scatter plot chart or bubble chart with multiple measures in the Vertical or Horizontal buckets, only the axis for the first measure in each bucket displays on the canvas. When you run the chart, all measure fields in the Vertical and Horizontal buckets are shown as separate axes, as intended.
- The Expression Editor has a an area that displays objects that you can add to an expression, which are columns, variables or functions. The selection and display of these was controlled by buttons above the area, but when then size of the area was compressed, some of the buttons were hidden. Now there is a single button with a pull-down menu that allows selecting what objects are displayed.
- Both the db_collation.sh file and the db_collation.bat file generate the "Main WARN Error while converting string [] to type," error message in the Command Prompt window at the end of their run. This message has no impact on the functionality of this post-installation utility, and it completes the run successfully.
- The load_repos.sh file generates the "WARNING: sun.reflect.Reflection.getCaller Class is not supported. This will impact performance," error message in the Command Prompt window at the end of its run. In addition, the db_inplace_update.sh, WFReposUtilCMDLine.sh, and update_repos.sh files generate the "Main WARN Error while converting string [ ] to type," error message in the Command Prompt window at the end of their run. These messages have no impact on the functionality of these post installation utilities, and each one completes its run successfully.
- App Studio upgrades are currently not supported. Messages related to failures that occurred while merging changes in the mime.wfs and languages.xml files display during the upgrade installation process.
- In Release 8207, you cannot install a standalone version of ReportCaster. If you attempt to do so, you receive an error message after you click Next to exit the Advanced Configuration page of the installation wizard. Currently, there is no workaround for this issue. However, you can successfully install ReportCaster by including it in a WebFOCUS installation.
- When using MS SQL Server as the database platform for the WebFOCUS Repository and upgrading from 8105M to 8207.06, only MS SQL Server 2008 and 2012 are supported. MS SQL Server 2014 and later versions are not supported.
Browser Information
This release is now certified and has been tested with Google Chrome version 83, Firefox version 77, Microsoft Edge Chromium version 82 (WebFOCUS only), Microsoft Edge version 44 (WebFOCUS only), and Internet Explorer version 11. Internet Explorer Compatibility mode is not supported. For additional browser details, see Browser Information.
- Release: 8207
- Category: About This Release