WebFOCUS 8207.15 Release Notes
The following topic provides all the information that you need to know about this release of WebFOCUS.
- Release and Gen Information
- New Features
- Fixes
- Upgrade Notes
- Known Issues
- Browser Information
- Release Information
- WebFOCUS Accessibility Compliance
Have questions? Click Send Us Feedback (on the right) and we'll be in touch!
Release and Gen Information
| Release Date | Gen Information | Reporting Server |
|---|---|---|
| Tuesday, August 25, 2020 |
wf082120a Gen 11 wi082120a |
8207.15 Gen 1920 |
New Features
Changing the Scrollbar Style in WebFOCUS Designer
When creating bar, line, and area charts in WebFOCUS Designer, you can change the scrollbar style from the Format tab, in the Axis options, by using the Scroll menu, allowing you to control how users navigate the chart when it shows a large number of sort values.
When a bar, line, or area chart has enough values on the x axis that all bars or points cannot fit comfortably, a scrollbar is generated by default. A limited number of bars or points are displayed in the chart at any given time, depending on the width of the chart area, and you can scroll to see additional values. You can remove the scrollbar by changing the Scroll option to Off. The values on the x axis are compressed together so that they all display on the chart.
As a third option, you can show the scrollbar on a minichart. The minichart shows a simplified representation of your chart with a translucent scrollbar layered over it, representing the area of the chart that is currently visible. This option provides additional context, so that you can have an idea of what the entire chart looks like, and use the scrollbar to see additional details about a specific area. An example of a bar chart that uses a minichart scrollbar is shown in the following image.
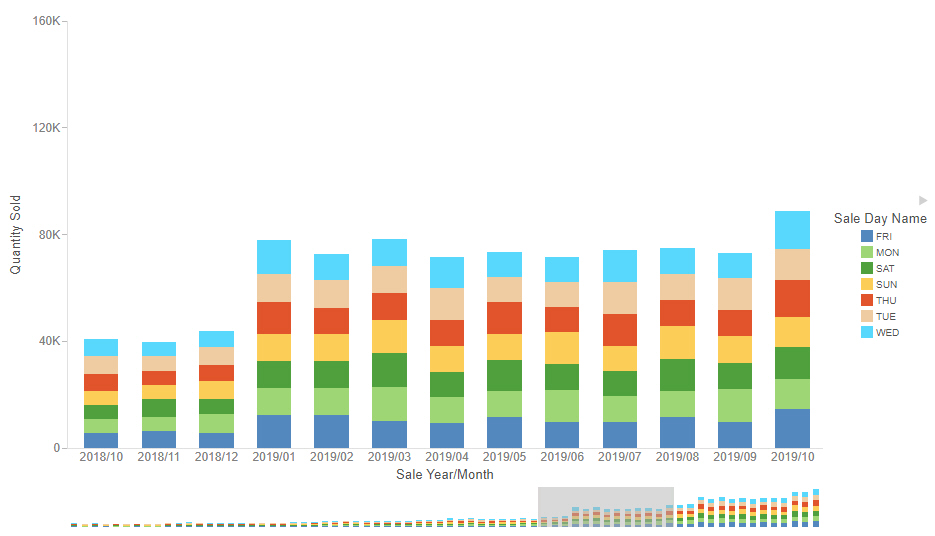
To enable the minichart scrollbar, set the Scroll option to MiniChart. When using the MiniChart option, you can also set the number of values that are visible on the x axis of the chart by using the Count option.
Support for Functions Used in ODBC Connector Client Tools
FOCUS and the SQL translator now support new functions used by client tools with the ODBC Connector.
For more information, see the Release Notes PDF.
Directly Accessing the Advanced Mode of Get Data
Using Get Data from the server console, or from the WebFOCUS home page option Prepare and Manage Data, opens a standard user interface with the most common options. A link on that page for Advanced mode provides additional options.
Now, users who always want to use advanced mode can enable the GET_DATA_ADV_DEFAULT setting.
With this setting in place, Get Data or Prepare and Manage Data will open the advanced mode of Get Data without first opening the simple mode.
For more information, see the Release Notes PDF.
Adapter for REST: Adding Scope to OAuth Access Token Request
When you configure a connection for the Adapter for REST using OAuth authentication, a Scope parameter has been added when you select the Password or Client Credentials Grant Type.
When there is a value configured for Scope, the Scope parameter will be sent in the Token request.
Support for Standard Deviation in PARTITION_AGGR
The PARTITION_AGGR function generates rolling calculations based on a block of rows from the internal matrix of a TABLE request. Population Standard Deviation (STDP) and Sample Standard Deviation (STDS) have been added as operations for the rolling calculation.
Note: Using the STDS or STDP aggregation operators requires that the request use the PRINT display command to avoid duplicate aggregation steps.
For more information, see the Release Notes PDF.
Opening a Data Flow From a Process Flow
The following image shows a Process Flow that runs four Data Flows open in the Server Web Console.
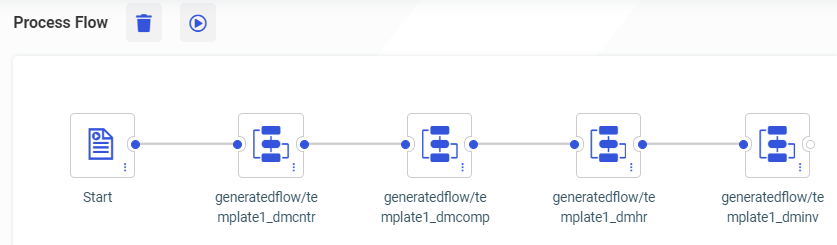
To open one of the Data Flows, right-click the flow you want to open and click Open, as shown in the following image.

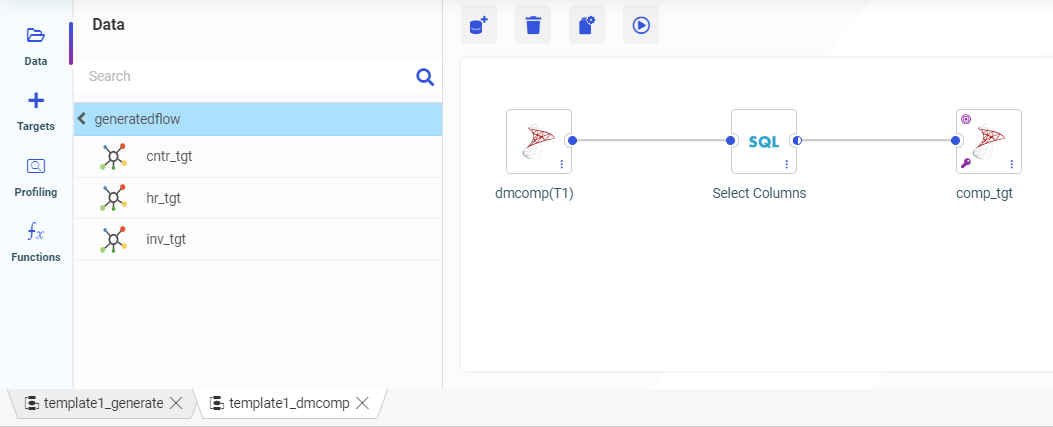
The Data Flow opens in a new tab, as shown in the following image.
Enhanced Sampling on Joined Tables
When Representative Sampling is enabled, you can prioritize joins in the sampling by setting the new parameter SMPL_PRIORITIZE_JOIN to Yes.
When preparing data using very large data sets, the performance of many tasks can be greatly improved by working with a representative sample instead of the entire data set.
However, when data sets are joined, sampling can be problematic when not all values of a joined column are present in both samples.
For example, when joining from a (large) sales fact table to a foreign key in a customer dimension table, sampling each table separately may not include rows from the customer table that match every customer key in the sample of the fact table.
When the new SMPL_PRIORITIZE_JOIN parameter is enabled, the first (fact) table selected is sampled first. Then, when the sample of the second (dimension) table is taken, every customer that was selected in the fact table is included in the sample of the dimension table. This ensures that every row in the fact table is matched.
For more information, see the Release Notes PDF.
Adapter for SharePoint Drive
The Adapter for SharePoint Drive is the WebFOCUS Adapter used to integrate with SharePoint Drive.
Instructions for configuring the Adapter for SharePoint Drive are included in the chapter Using the Adapter for SharePoint Drive of the Adapter Administration manual.
Output formats such as PDF, JSON, and XML generated from WebFOCUS reports can be stored in SharePoint Drive.
Adapters, such as JSON and XML, can be used to report against their respective documents stored in SharePoint Drive.
Fixes
- Conditional styling is lost in AHTML report with ACROSS and NOPRINT. (190123118, 90501052, 200305105, 200305026, 200409065)
- When adding a function to a data flow and hovering over a source node in a data flow, the Union and Join bubbles appear inappropriately.
- When adding or configuring an ODBC Connector through an ODBC Data Sources (64 bit), the connection cannot be saved unless a description is entered.
- When opening a data flow with joins and it does not contain keys on a new Target, the flow is re-parsed and the keys are added automatically. (200611036)
- MANDATORY Filters are not executed with a COMPUTE in a Master File. (200729067)
- When adding a DEFINE field in a parameter in InfoAssist, an error occurs. (200805058)
- When embedding custom font "Raleway" into a PDF output and using WRAP in InfoAssist, text is not displayed correctly. (200709142)
- After saving and closing a chart created in WebFOCUS Designer using a Reporting Object and a chart extension, you cannot reopen the chart. (200618007)
- Error occurs when restoring a user defined geo role. (200518029, 191120175, 190430020, 190607027)
- Double-clicking on filters in the field list when in Query mode adds previous added filter. (200730001)
- When a user attempts to add a new calculation after moving the expression window, the user is unable to input any characters. The user is only able to select the buttons but cannot type directly into the canvas. (200724055)
- Setting the limitExplodeCount setting to true does not work. (200625072)
- Compute is not working with conditional styling enabled in InfoAssist. (200605024)
- When editing "Change title" using certain symbols, the title changes to the HTML entity names.
- Sorting a table shifts all the columns to the left outside of their proper headers on the Shared with Me and My Workspace pages while using Internet Explorer 11. (200528045)
- Some errors and warning messages are displayed in a bolder and centered in a dialog which makes them hard to read on the Server Console.
Upgrade Notes
- As of WebFOCUS 8207.15, the default setting for ALLOW-NOPRINT is ON. In AHTML reports using the new Designer style (ARVERSION=2), you can select hidden or NOPRINT fields, when you create a new component from the Options menu. These fields are also available in the fields list, when you create a chart, rollup, or pivot from the Column menu.
- When upgrading from release 8206.xx to 8207.xx, the WebFOCUS Integrated Installation does not automatically assign the Unicode UTF-8 (CP65001) code page to the Reporting Server configuration. In order to configure the Reporting Server to use the UTF-8 code page, you can select the entry directly from the CODE_PAGE? list. In the Web Server console, this list appears in the NLS Configuration tab of the Workspace node.
We recommend that you apply this change because, as of release 8207, WebFOCUS Integrated Installations configure all installed components to use the UTF-8 code page. Changing the Reporting Server code page to UTF-8 will ensure that there is no mismatch of code pages between WebFOCUS, Tomcat, and the Reporting Server, which could result in data retrieval issues. - In Release 8207, Magnify functionality is not available. To add Magnify functionality to Release 8207 and higher, see the manual steps outlined in this topic.
- As of Release 8207, in App Studio, the Domains node in the Configured Environments tree has been renamed to the Workspaces node.
- The WebFOCUS Server on Linux using the Adapter for salesforce.com now requires using OpenSSL version 1.1.1. While current distributions include this release older ones do not.
This software can be downloaded from https://www.openssl.org/source/ and it must be compiled with the shared option.
Ater this, create symbolic links to the required libraries. For example, if the directory used was /usr/local/ssl, issue the following commands:
sudo ln -sf /usr/local/ssl/lib/libssl.so.1.1 /usr/lib64/libssl.so
sudo ln -sf /usr/local/ssl/lib/libcrypto.so.1.1 /usr/lib64/
libcrypto.so
Known Issues
- The WebFOCUS help system does not work when the Application Server is configured with Java Version 11. As a workaround, you can configure your WebFOCUS instance to use help hosted by IBI. This provides an additional benefit, as users will have access to the latest content. See the workaround in the Release Notes PDF.
- The canvas of WebFOCUS Designer for this release is an interactive canvas based on AHTML. When creating a report, page and row break settings are not supported on this canvas for this release. If you select any other output format, such as HTML, PDF, PPTX, or XLSX, you will see these breaks at runtime. These output format options are available for stand-alone content items only. This will be resolved with the introduction of the non-interactive document canvas in a future release.
- When an Insight-enabled chart created in the 8207.00 version of WebFOCUS Designer is added to a visualization as external content, the Insight icon does not appear on the chart when the page is run, so Insight features cannot be accessed. Resave the chart in WebFOCUS Designer 8207.01 or later to make Insight available when the chart is added to a visualization.
- When working with the Cell menu in an interactive report, the filtering functionality does not work as expected.
- When saving an artifact (from or of and interactive report, chart or dashboard), the output file name is ARsave.html rather than ARhtml.html.
- If you create a report or chart in ARVERSION=2 (In-Document Analytics) and you set the output format to PDF Analytic Document, an error occurs when you run it. If you change the option in Procedure Settings to Legacy, the report or chart is produced correctly.
- If you are working with an In-Document Analytics chart in landscape mode on an Android mobile device and you switch to portrait mode, your content displays in fullscreen mode. Your chart displays at the bottom. If you run your content in new window mode, your In- Document Analytics chart does not display in fullscreen mode, displaying the chart on the right.
- HIDENULLACRS, which hides across columns that have null or zero values in the entire column, is not supported with interactive content using the new Designer style of In- Document Analytics capabilities.
- If you add an existing ARVERSION=1 report to an AHTML document set to ARVERSION=2, it fails at run time, displaying JSON text on the screen instead of the expected report output.
- If you are working with a procedure (.fex) and you change the ARVERSION to ARVERSION=2, global filters do not display when you run the procedure.
- In a scatter plot chart or bubble chart, multiple measure fields on the horizontal and vertical axes generate separate axes, resulting in a grid of scatter plots for each combination of measure fields. In WebFOCUS Designer, if you create a scatter plot chart or bubble chart with multiple measures in the Vertical or Horizontal buckets, only the axis for the first measure in each bucket displays on the canvas. When you run the chart, all measure fields in the Vertical and Horizontal buckets are shown as separate axes, as intended.
- The Expression Editor has a an area that displays objects that you can add to an expression, which are columns, variables or functions. The selection and display of these was controlled by buttons above the area, but when then size of the area was compressed, some of the buttons were hidden. Now there is a single button with a pull-down menu that allows selecting what objects are displayed.
- Both the db_collation.sh file and the db_collation.bat file generate the "Main WARN Error while converting string [] to type," error message in the Command Prompt window at the end of their run. This message has no impact on the functionality of this post-installation utility, and it completes the run successfully.
- The load_repos.sh file generates the "WARNING: sun.reflect.Reflection.getCaller Class is not supported. This will impact performance," error message in the Command Prompt window at the end of its run. In addition, the db_inplace_update.sh, WFReposUtilCMDLine.sh, and update_repos.sh files generate the "Main WARN Error while converting string [ ] to type," error message in the Command Prompt window at the end of their run. These messages have no impact on the functionality of these post installation utilities, and each one completes its run successfully.
- App Studio upgrades are currently not supported. Messages related to failures that occurred while merging changes in the mime.wfs and languages.xml files display during the upgrade installation process.
- In Release 8207, you cannot install a standalone version of ReportCaster. If you attempt to do so, you receive an error message after you click Next to exit the Advanced Configuration page of the installation wizard. Currently, there is no workaround for this issue. However, you can successfully install ReportCaster by including it in a WebFOCUS installation.
- When using MS SQL Server as the database platform for the WebFOCUS Repository and upgrading from 8105M to 8207.06, only MS SQL Server 2008 and 2012 are supported. MS SQL Server 2014 and later versions are not supported.
- When creating stacked bar, area, and line charts in WebFOCUS Designer, you can select Show stacked totals, in the Series options on the Format tab, to show the total value of the stacked riser above each bar or point in the chart. You can also use series-level data labels to show a value for each series, representing a subset of the stacked riser. If the position of the series-level data labels is set to Above, then the label for the top-most series may overlap with the total label for the stacked riser. To avoid this overlap, select a different option from the Position menu.
Browser Information
This release is now certified and has been tested with Google Chrome version 84, Firefox version 79, Microsoft Edge Chromium version 83 (WebFOCUS only), Microsoft Edge version 44 (WebFOCUS only), and Internet Explorer version 11. Internet Explorer Compatibility mode is not supported. For additional browser details, see Browser Information.
- Release: 8207
- Category: About This Release