Enhancements


Exploring Workbook Creation Options

A workbook combines a page and multiple charts into a single file. Using a workbook, you can create a data flow to engage in data discovery, create charts to analyze that data, and add multiple charts to a page for a broader perspective. Using a workbook is a quick way to explore your data in a single session, providing the ability to save multiple content components together for easy access.

Exploring Page Creation Options

You can create interactive responsive pages using content that you or other members of your organization create. Content can be added to a page by utilizing drag-and-drop actions. With the interactive canvas, you can resize and rearrange resources with ease. Additionally you can use the integrated filter control capability to create instant, compelling applications and InfoApps from your content.

Using the Variables Tab

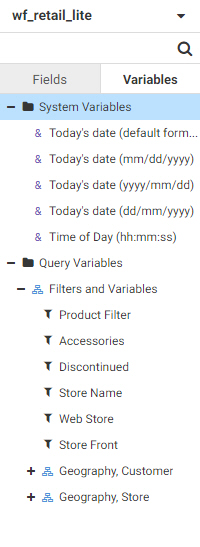
The Variables tab contains a set of predefined parameters that you can use to add information to the chart header or footer, build dynamic calculated fields, or quickly create filters based on conditions defined in the data source.

The available variables are divided into two sections, System Variables and Query Variables, as shown in the following image.

Variables tab

System Variables are predefined variables that are always available for use. These are:

Using the Fields Tab

The fields in your data source are available from the Fields tab. By default, if the data source uses folders to organize the fields that it contains, these folders are reflected in the Fields tab. This folder organization is called a business view. For dimension fields, these folders could be field hierarchies defined in the data source or segments in the data based on different tables that have been joined together. Measures can also be grouped based on segments.