How-to's


Changing the Size of Charts and Risers

By default, when you create a chart, it fills the frame in which it is run, and risers and other sections within the chart are sized accordingly. This makes the chart flexible, allowing it to run in large and small containers alike without sacrificing the appearance and legibility of the chart. This automatic sizing also means that you do not need to manually set any size properties for the chart.

Video: How to Style Reports in TIBCO WebFOCUS® Designer

You can style the text and cells of different areas of a report to visually highlight or separate different groups of values, such as columns, column headers, across field values, and totals, in order to call attention to certain information in a report.

Video: How to Use New or Existing Content in Pages

Using WebFOCUS Designer, you can create a single content item – either a chart or report – or you can create a page that contains multiple items. There are two different kinds of pages.  These pages are similar in appearance and general functionality, but provide a slightly different set of options, particularly when it comes to filtering behavior.    Show a finished page

Scheduling a Data Flow

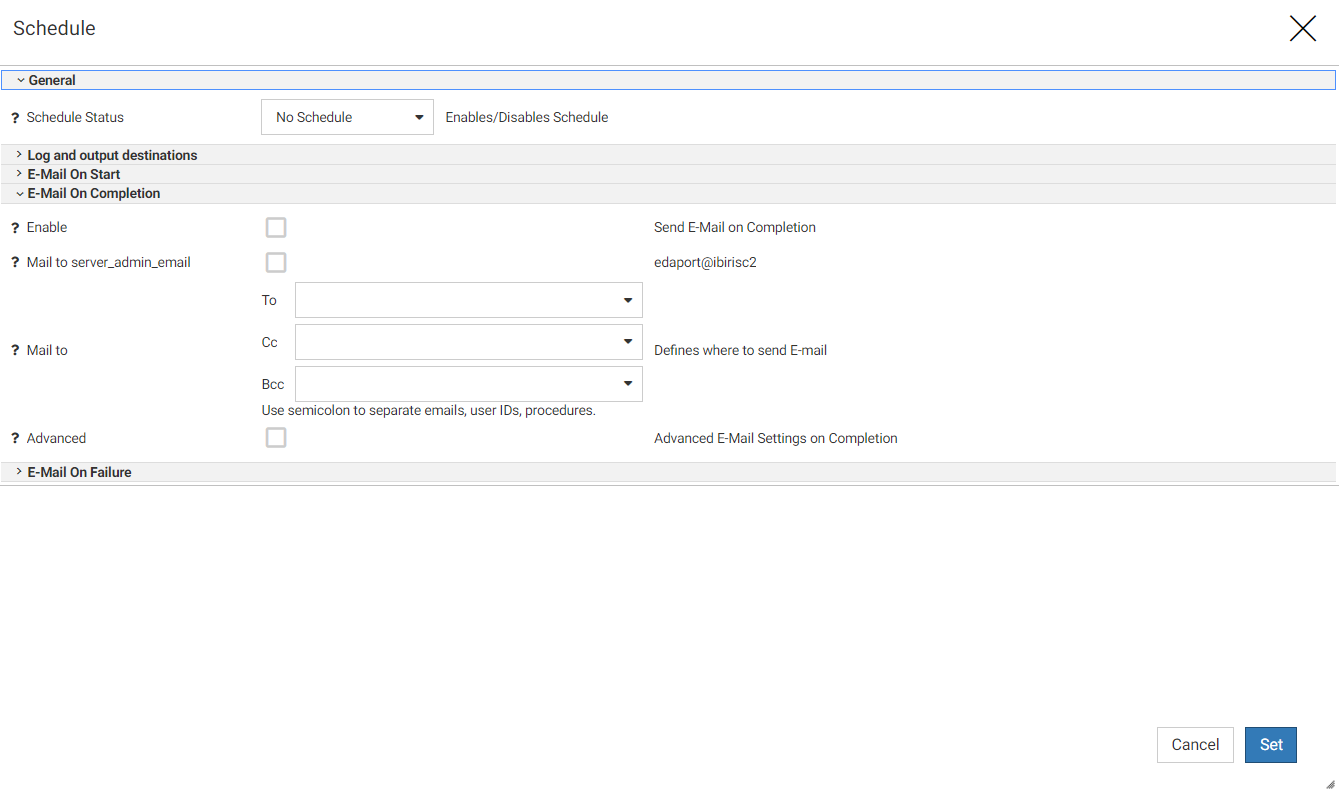
You can create a schedule that will run a data flow on a specified data and time, or on a recurring basis. You can configure where the logs and outputs are sent. You can also send emails on start, completion, or failure.

To create a schedule for a flow, click the Schedule and E-Mail button () on the ribbon.

The Scheduler window opens, as shown in the following image.