How-to's


Importing Sample Users and Exploring Retail Samples

This section describes how to import several sample users for testing/verification purposes and further explore the Retail Samples content.

Procedure: How to Import Sample Users and Explore Retail Samples

  1. Ensure that you are signed in to WebFOCUS as an Administrator.
  2. On the WebFOCUS Home Page, open the Settings menu and then click Security Center, as shown in the following image.

    opening the Security Center

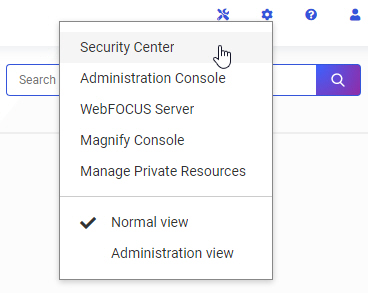
    The Security Center opens.

Providing Access to Content Items and WebFOCUS Tools

When assembling pages from existing content in WebFOCUS Designer, two preset containers are available that allow you to provide access to content saved to your Repository. These are the Workbench template and the Explorer widget. In addition to running content, the Explorer widget allows users to create new content using the same options that are available on the WebFOCUS Home Page.

Controlling the File Compression of Interactive Reports

When creating interactive reports enabled with In-Document Analytics capabilities, you can use the ARCOMPRESS setting to modify file compression and generate output more quickly. You can only modify the file compression of interactive reports that use the Designer style of In-Document Analytics, identified by the setting ARVERSION=2. 

Syntax: How to Control File Compression to Improve Performance

To control the file compression of interactive reports that use In-Document Analytics, use

SET ARCOMPRESS={ON | OFF}

where:

Formatting Box Plots

A box plot is a common chart type used to show key distribution information for a set of data points. A box plot displays outliers, the median, the upper and lower quartile, and the maximum and minimum with outliers excluded, by default. However, you can use the Box Plot options on the Format tab to show the mean, or average, as well. Additionally, you can change the display of the whiskers from lines to boxes, and change the style of the median and whisker lines.

Creating Statistical Box Plot Charts

A box plot, also known as a box-and-whisker plot, is a chart type that provides distribution information about your data. The box represents the range between the upper and lower quartiles, and the line inside the box represents the median. The whiskers represent the maximum and minimum with outliers excluded, and outliers are represented by individual points. An example of a box plot is shown in the following image.


boxplot

Testing the Designer Portal User Experience

Before you can announce the availability of the portal for general use, you must first ensure that the appropriate theme and logo are assigned to the portal for users from each tenant group.

Remember that the portal fails to display content properly when you run it in the centralized enterprise workspace. You must base your testing on how the portal appears to users from each tenant group, not in the centralized workspace.

Publishing Content

When the designer portal is ready and all tenant workspaces and tenant workspace groups are prepared, you must make the portal and related workspaces available by changing them to Published status.

Procedure: How to Publish a Designer Portal

  1. Sign in as an administrator, if you are not signed in already.
  2. Right-click the portal in the content area of the WebFOCUS Home Page and select Publish from the shortcut menu.

Adding Tenant-Specific Portal Pages to the Centralized Designer Portal

To include tenant-specific portal pages in the centralized designer portal, you must add shortcuts for the linked pages to the centralized portal.

To ensure that tenant-specific portal pages appear only to the tenant groups to whom they apply, you must create the shortcut to the page within the tenant workspace. You must then copy the shortcut from the tenant workspace and paste it to the portal folder within the workspace that contains the centralized portal.