Release Features


Bookmarking Control Selections in a Page

Bookmarking allows users to save filter control selections and other run-time content customizations that they make in a page so that they can easily reapply them when they run the page again later. This is especially useful when there are many filter controls on a page that a user may want to apply each time they access it. Bookmarks are personal to each user and can easily be created and deleted as needed.

Processing Format Conversion Errors when Uploading Data

When uploading data from a delimited or Excel file, a format conversion error can occur, such as when a numeric field contains a non-numeric value. You have load options to control how to process rows that contain format errors, and to control how many format errors are allowed before processing stops.

The following conversion error load options are available when uploading files:

Formatting Box Plots

A box plot is a common chart type used to show key distribution information for a set of data points. A box plot displays outliers, the median, the upper and lower quartile, and the maximum and minimum with outliers excluded, by default. However, you can use the Box Plot options on the Format tab to show the mean, or average, as well. Additionally, you can change the display of the whiskers from lines to boxes, and change the style of the median and whisker lines.

Creating Statistical Box Plot Charts

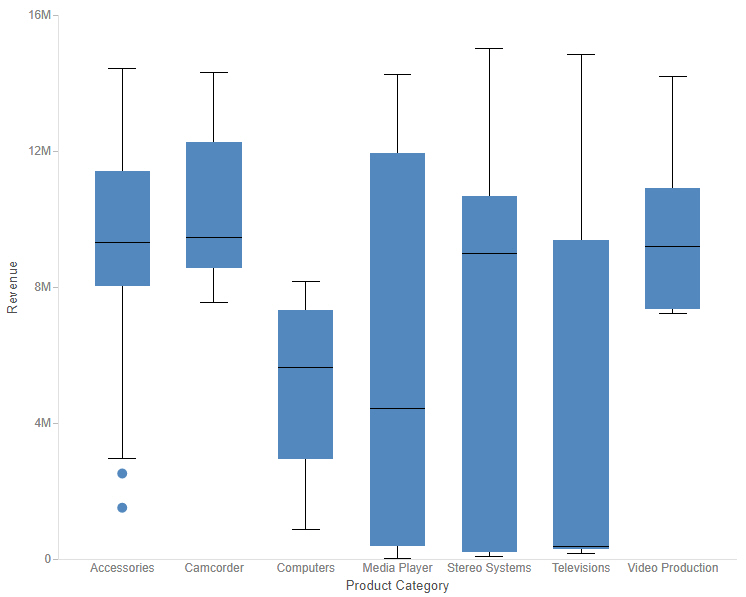
A box plot, also known as a box-and-whisker plot, is a chart type that provides distribution information about your data. The box represents the range between the upper and lower quartiles, and the line inside the box represents the median. The whiskers represent the maximum and minimum with outliers excluded, and outliers are represented by individual points. An example of a box plot is shown in the following image.


boxplot

Exporting a Page as a PDF or Image

You can instantly download a snapshot of your page as a PDF document or .png image using the Export to file menu on the page toolbar. This allows you and anyone running the page to quickly capture its current state, with filter selections applied, in a format that can be easily reused, distributed, added to PowerPoint presentations, and more.

Configuring Sample Data Settings

When you create charts, reports, and pages in WebFOCUS Designer, the canvas displays a design-time preview of your content. By default, the preview uses a subset of the data available in your selected data source, saving on the resource usage required in running a full data set, while still providing a representative and useful preview of your content.

Introducing the TIBCO WebFOCUS® Mobile App

The WebFOCUS® mobile app is a simple, intuitive app that empowers users to perform reporting and analysis right from their mobile devices. The WebFOCUS mobile app delivers rich, deep, highly interactive analytic functionality, fully exploiting the native device gestures that are already familiar to the user. With the WebFOCUS app, you can manipulate data from a variety of sources in an almost unlimited number of ways in just a couple of taps. The app allows you to manage business dashboards and content, even when you are not connected to the Internet.

Displaying Measure Values in Charts

In most chart types, measure values for different categories are communicated based on visual cues. For example, the height of a riser in a bar chart, the size of a slice in a pie chart, or the color or an area of a heatmap all communicate the measure value of the dimension value that they represent. By comparing different areas of the chart, and by using the legend and tooltips, you can quickly identify overall trends in your data.

Adding Drill-Down Links to Content

Drilldowns are a powerful feature that allows users to navigate from one content item to another, providing access to additional, related information at run-time. Drill-down links can also be used to pass parameters, so that the target content is automatically filtered for the value that a user selects, allowing you to maintain context between items. By linking content with drilldowns, you can vastly expand the amount of information that is available from a single chart or report.