Release Features


Chaining Filter Control Selections

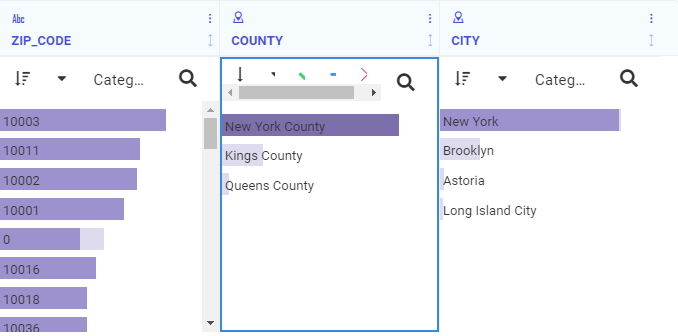
When a content item or page includes multiple filters, chaining ensures that those filters always return valid values to your content. When you select a value from one of the filter controls, the other controls can be filter and updated based on the value that you select, if chaining is applied. For example if you have a filter for Sale Quarter chained to a filter for Sale Month, then when you select Q1 from the Sale Quarter filter, the Sale Month filter updates to show only the months of January, February, and March, and automatically excludes any month values that were not in Q1.

Applying a Filter in a Data Flow

Using Citi Bike trip data, we will restrict our analysis to rides that start in Manhattan, so we can limit the data loaded to just that borough. The geographic data identifies the county, so we will just load the data in New York County.

  1. In the COUNTY field, click the bar for New York County.

    The display changes to reflect the selection. The dark portions of the bars in each column show the proportion of rows that are selected, as shown in the following image.

Showing Profiling in a Data Flow

You can generate a distribution chart for each column in the flow, which shows a visual image of the field values. The profile chart displays below the field name and shows:

  • The range of values for numeric and date fields.
  • The count of unique values (categories) for character fields.

To show the profiling distribution charts:

Editing Fields in a Data Flow

By default, all fields in a single-segment data source, or all fields from top segment in a multi-segment data source are automatically added to flow. You can turn off this option in the Advanced Options dialog box.

To edit the fields in the flow, right-click the SQL object, and click Edit. The Metadata and Query panes open.

Enabling Sampling for a Data Flow

When a data source in a flow has a large volume of data, you can enable sampling for better response time. You can make decisions based on a sample, provided that sample is representative of the entire data set. Data Prep has a built-capability to automatically generate a random sample (with a 99% confidence level and +/- 1% margin of error).

To enable sampling: