Adding and Replacing Fields in a Flow
You can add new fields or replace existing fields by creating expressions.
Each filed has a menu icon ( )
)
The menu provides the following options:
- Format. Opens the Edit Display Format dialog box.
- Rename. Enables you to change the title of the field.
- Replace with Expression. Enables you to create a new field with values derived using a calculation.
- Add new Expression. Enables you to create a new field with values derived using a calculation.
- Delete. Removes the field from the flow.
Calculated fields also have:
- Properties. Opens the Properties dialog box.
- Edit Define (Advanced). Opens the Advanced Expressions dialog box.
When aggregated, fields also have :
- Edit Compute (Advanced). Opens the Advanced Expressions dialog box.
- Aggregations. Enables you to select an aggregation operator.
- Add to Filter Aggregated. Opens a filter card for the field.
Order by fields also have:
- Sort. Options are Ascending or Descending. The default is Descending.
- Rank. Options are Yes (ranks the values in addition to sorting) or No. The default is No.
- Limit. Options are No Limit, 1, 5, 10, or custom. The default is No.
- Visibility. Options are Show or Hide. The default is Show.
- Add to Filter. Opens a filter card for the field.
When you create an advanced expression, you use the expression calculator, which is shown in the following example.
Example: Creating a New Trip ID Field
To create the TRIP_ID field, click the menu icon in the tripduration column and click Add New Expression, then Advanced Expressions.
The Add Detail (Define) Expression Calculator opens. Enter the value Trip ID for the Title and Name will be filled automatically as TRIP_ID. For the expression enter TRIP_ID + 1. This creates a counter, where the value for each row increases by one.
Optionally, you can click Validate to make sure that the expression is valid. As the expression is arithmetic, the format changes from alphanumeric to integer, as show in the following image.
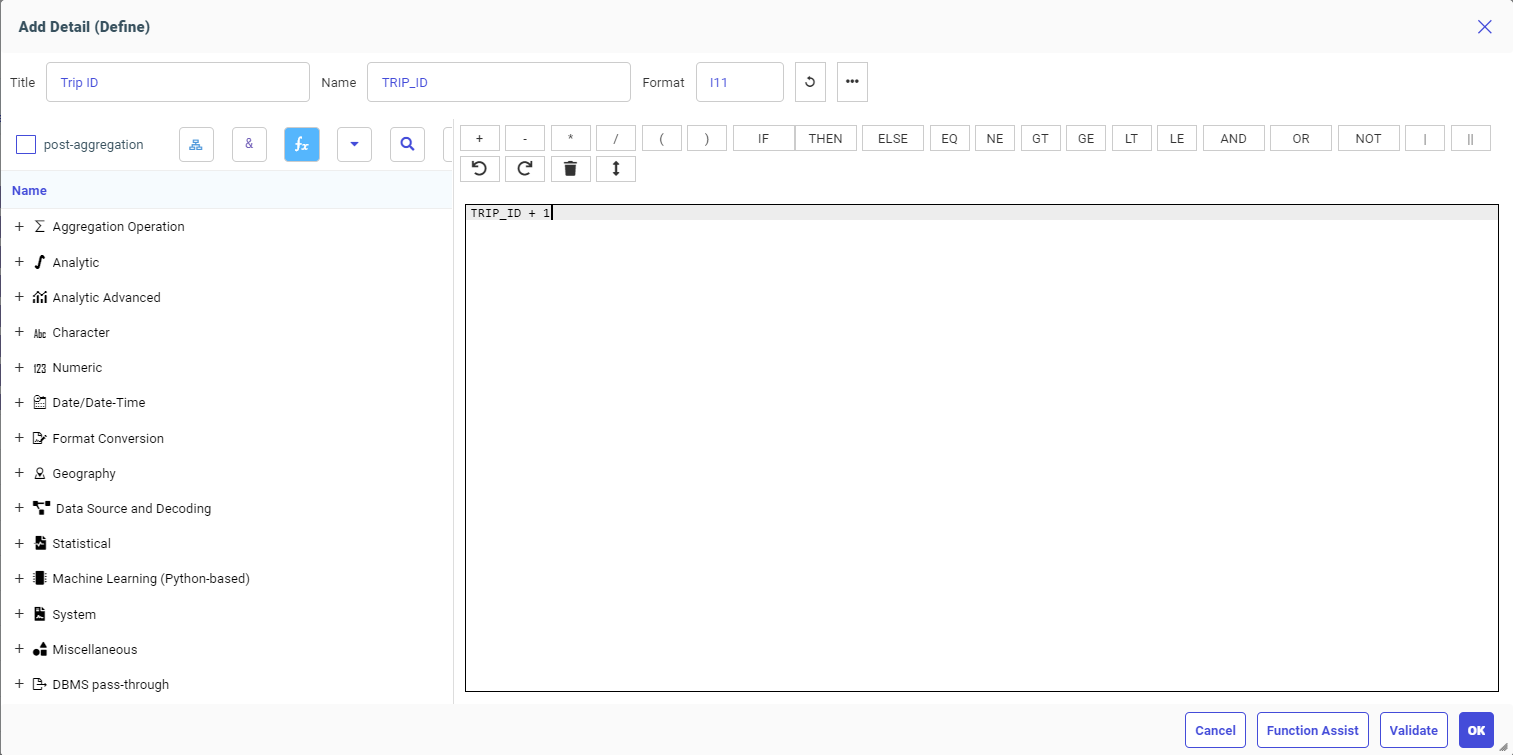
Click OK to add this field to the flow.
Example: Creating a New Field with Trip Duration in Minutes
Trip duration is more meaningful when expressed in minutes instead of seconds.
To create the TRIP_DURATION_MINUTES field, click the menu icon in the tripduration column and click Replace with Expression, then Advanced Expression.
The Add Detail (Define) Expression calculator opens. Perform the following steps:
- Enter the title Trip Duration,Minutes. The field name becomes TRIP_DURATION_MINUTES.
- After the text tripduration add a division sign and the number 60 (tripduration/60) to calculate minutes.
- Click OK.
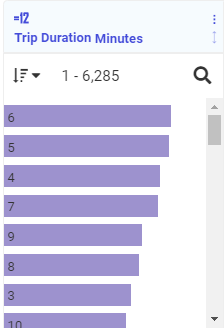
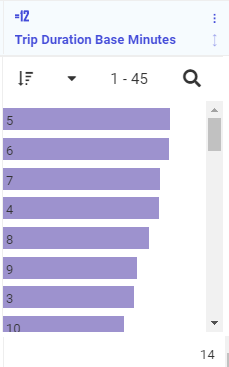
The tripduration field is replaced by the Trip Duration Minutes field. The profiling distribution chart for this field shows that the most common trip durations are in the four to seven minute range:
Example: Creating New Fields that Calculate Time Limits and Overages
In this example, we will calculate trip limits and overages.
Trip Limit
Allowed minutes are conditional based on their user type. The allowed minutes for Subscriber is 45, and for Customers 30.
- Click the usertype column, and click Add new expression, then Advanced Expression.
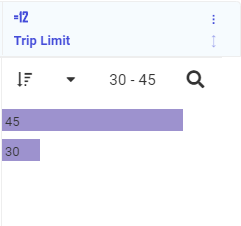
The Add Detail (Define) Expression Calculator. Enter the value Trip Limit for the Title, and Name will be filled in automatically as TRIP_LIMIT. For the expression, enter the following conditional expression:
IF usertype EQ 'Subscriber' THEN 45 ELSE 30
- Click OK.
The field is added, as shown in the following image.
Base Minutes
Next we will create a field with the number of base (included) minutes for each trip. This value is the trip duration in minutes, if that is not greater than the trip limit. If it is greater, we will use the trip limit as the value, and then calculate how many minutes of overage the trip used. We will generate the base minutes field by applying the MIN function, which returns the minimum value of its arguments.
- Click the menu icon in the Trip Limit field, and click Add new Expression, then Apply Function.
- The Apply Function dialog box opens and the Numeric folder opens.
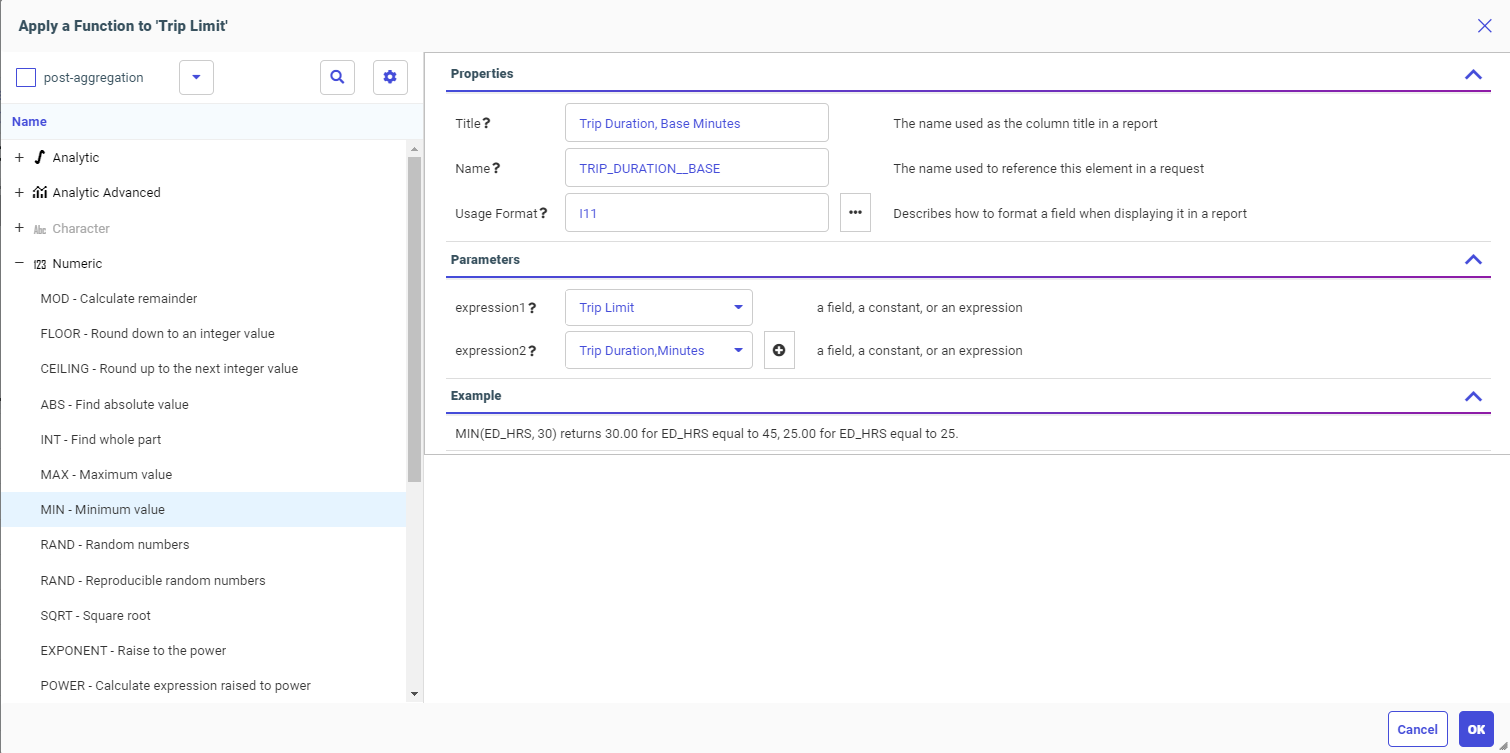
- Click the function MIN - Minimum Value.
- The properties for the MIN function open, with default values for the Title, Name, Usage Format, and first expression fields.
- Change the default entries by entering the following values.
- Title: Trip Duration, Base Minutes.
Name: The default name becomes TRIP_DURATION_BASE_MINUTES. Change it to TRIP_DURATION_BASE
- Usage Format: I11, or click the menu button to get a properties panel where you can select Integer and type in the length.
- Expression1: Trip Limit (this was already there, by default)
- Expression2: Trip Duration,Minutes (select this field from the drop-down list).
The completed dialog box is shown in the following image.
- Title: Trip Duration, Base Minutes.
- Click OK.
The field is added, as shown in the following image.
Overage Minutes
Next, we will create a field with the number of minutes over the allowed amount (if any).
- Click the menu icon in the Trip Limit field, click Add new expression, then Apply Function.
- The Apply function dialog box opens and the Numeric folder opens.
- Click the function MAX - Maximum Value.
- The properties for the MAX function open, with default values for the Title, Name, Usage Format, and first expression fields.
- Change the default entries by entering the following values.
- Title: Trip Duration,Overage. The default name becomes TRIP_DURATION_OVERAGE
- Usage Format: I11
- Expression1: 0 (zero)
- Expression2: TRIP_DURATION_MINUTES - TRIP_LIMIT. This calculates the overage. If it is greater than zero, this value will be returned. Otherwise zero is returned.
- Click OK.
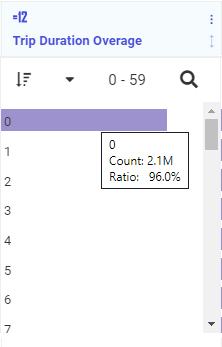
The field is added. Since we omitted trips over 90 minutes, the overages are from 0 to 59 minutes. Hover over the zero bar and you can see that approximately 96% of the trips have no overage, as shown in the following image.
Example: Creating New Fields with Date Components
This trip data includes a time stamp, to the millisecond, that each ride started. For visualization, we want to break these files into their component value, Year, Month, and Day of Month.
Start Year, Start Month, Start Day
- Click the menu icon in the starttime column, click Add new Expression then, Decompose Date...
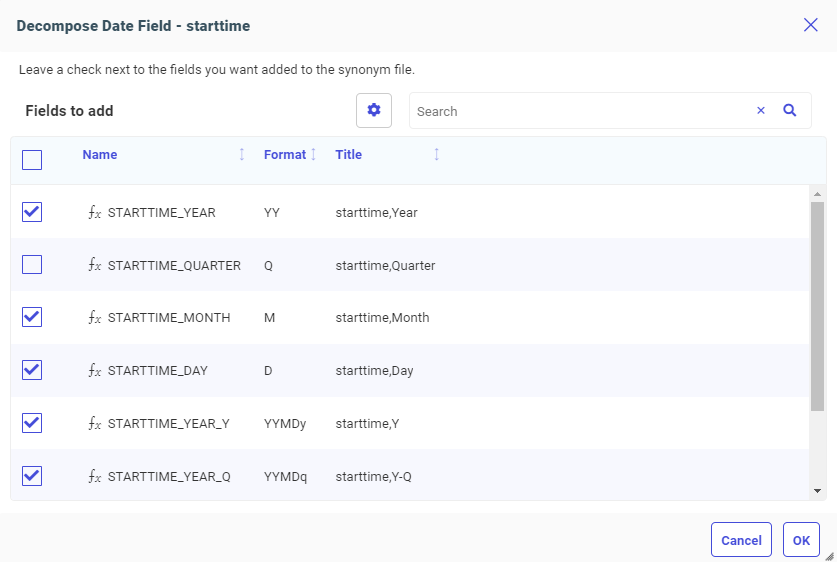
- The Decompose Date dialog box opens.
- Check the following components.
- STARTTIME_YEAR
- STARTTIME_MONTH
- STARTTIME_DAY
Leave the default selection as is, as shown in the following image.
- Click OK.
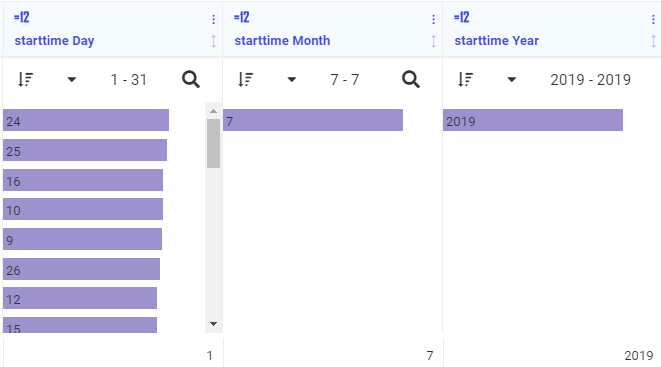
The fields are added, as shown in the following image.
Hour of the Day
The date function DPART returns components from a date or date-time field. Extracting the hour of the day will show how usage varies during the day.
- Click the menu icon in the starttime column, click Add new Expression, then Apply Function.
- The Apply Function dialog box opens, with the Date/Date-Time functions open.
- Double-click DTPART to select it.
- The properties panel for DTPART opens.
- Enter or select the following values.
- Title: Start.Hour. The Name becomes START_HOUR.
- Component: HOUR (select this from the drop-down list)
- Click OK.
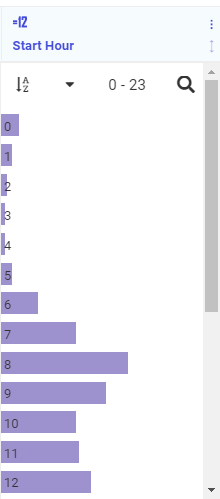
The field is added, as shown in the following image.
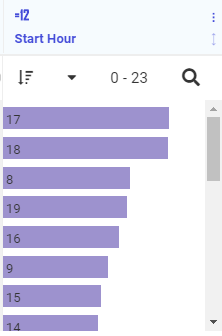
To get a better idea of usage throughout the day, click the down pointing triangle and click Sort by Value. The distribution chart is now sorted by hour of the day, as shown in the following image.
Example: Creating a New Field With Age
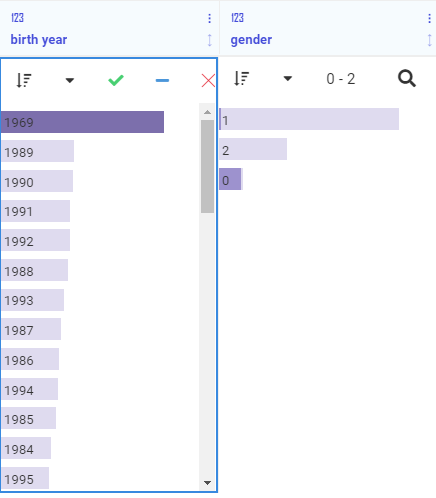
The trip data includes the birth year for each subscriber, but age age would be more meaningful. The range of values for birth year starts at 1885, which is very unlikely. Also the most frequent birth year is 1969.
Click on the bar that represents 1969. This highlights the percentage of each value in the other columns that correspond to birth year 1969. Most of them have gender 0 (not identified), as shown in the following image.
In addition, if you scroll over to the usertype column, you see that most of them are Customers (day pass buyers), not Subscribers. This indicates that the 1969 is a default birth year for customers.
You can remove the selection for 1969 by clicking the red X in the column header.
To add a field for age:
- Click the menu icon for the birth year column and click Add new Expression, then Advanced Expression.
The Add Detail (Define) dialog box opens.
- Enter the title Age. The field name becomes AGE.
- Click the Columns button (
 )
)
The folder tree opens.
- Scroll down and drag starttime,Year to the input area. enter a minus sign (-) after this. and drag birth year after the minus sign.
The following image shows this expression./p
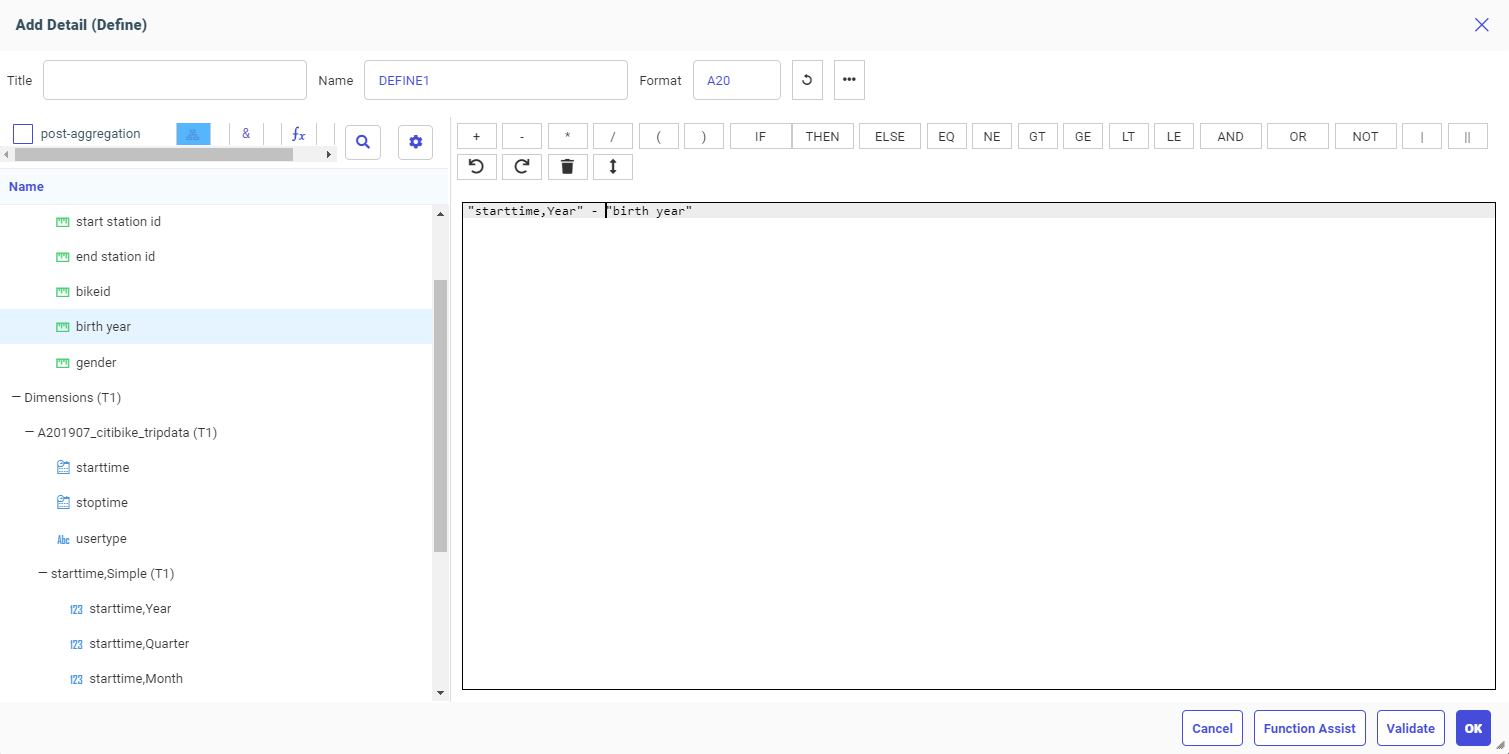
This will be the calculation for the age of those riders that fall within the age parameters we want to see.
However, we want to omit riders who are Customers with the birth year 1969, or any rider born prior to 1939, so we will set their value to Missing.
- Edit the expression to be the following
IF "birth year" LT 1939 OR ("birth year" EQ 1969 AND usertype EQ 'Customer' ) THEN MISSING ELSE "starttime,Year" - "birth year" - Click the Validate button to make sure the expression is valid.This also refreshes the format. You can also click the Refresh button to update the format.
- Click OK.
The age range is 16 through 79, and the most common age is 30
Example: Creating a New Field with Gender as Text
The trip data includes the gender of each subscriber as code 1 or 2 (zero for unknown). For our visualizations, we want to use the labels Male or Female, and when those are not supplied, we will use NULL or Missing.
To create the GENDER_TEXT field:
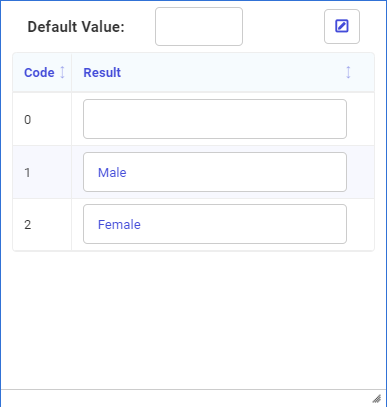
- Click the menu icon in the gender column, and click Add new Expression, then Create Decode.
A Decode card options.
- Enter Male for 1, Female for 2, as shown in the following image.
- Click the Edit button (
 ) and enter the following values.
Name: GENDER_TEXT.
Title: Gender.
- Click OK
- Click outside the Decode card to close it.
- Release: 8207
- Category: Accessing Data, Connecting to Data, Data Management
- Product: Reporting Server
- Tags: Release Features