Adding Color to Charts
By adding color to your chart components, you can change the way information is perceived and plays a large role in the effectiveness of your chart.
Color adds contrast to your charts, giving you an advantage in presenting unique, well-balanced content. You can use color to highlight a specific aspect or outcome on your chart. WebFOCUS Designer provides a color picker to add color and style your chart.
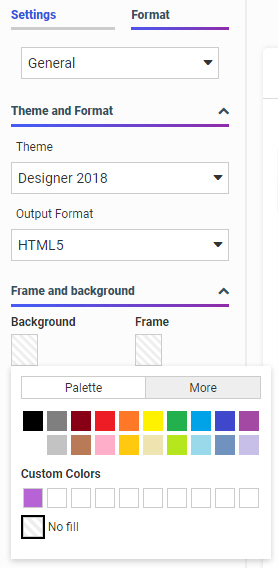
You can access the color picker in two primary ways: on the Format tab and at the top of the canvas when formatting headers and footers. Using these options, you can change the color of different components to style your chart. You can indicate color values and ranges to highlight data. You can color a chart component (for example, a header or axis), text, or even add colored lines to accentuate the background grid of your data. You can also change the theme, which changes the color palette and background of your chart.
The following image shows an example of color options that display on the Format tab (with the palette exposed), which you will also see in other areas where color formatting is supported:
The following image shows the options that display at the top of the canvas (with the palette exposed) when working with headers and footers.

Note: When specifying a theme, you can use the default or specify another one. The colors stored for the theme are part of the underlying .css or .sty file, which contains the color schemes.
In WebFOCUS Designer, the color picker supports a colorspace and a palette-based approach, as shown in the following image.
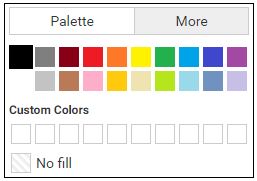
You can access the color picker from any of the sections on the Format tab. You can also access the color picker when working with headers and footers. When you access the color picker, the color picker displays the Palette tab, by default. From this tab, you can select from up to 20 pre-defined color options. You can also select the No Fill option, which displays the selected content as transparent. This is particularly useful in cases where you might want to prevent (or hide) the display of information.
The More tab allows you to choose a custom color by interacting with a hue wheel and the color value field, as shown in the following image.
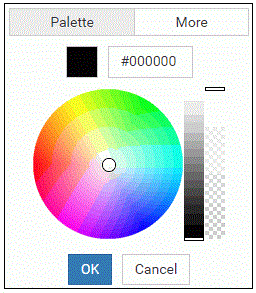
You can specify an exact color code (hexadecimal or HTML) by entering it in the color value field located at the top of this tab, and also specify transparency by using the transparency slider.
Note: When a custom color is selected and you click OK, the color is automatically added to the Custom Colors section in the Palette tab.
You can also set a color range for a measure in your chart. This allows you to specify hues or ranges of color for use in your chart. In cases where Theme is not selected, the color specification overrides what is available in the theme. The color that you select dictates the legend, which in turn displays the various chart components, based on the colors and measurements specified.
To change the color scale options, right-click a measure in the Color bucket and select Set color ranges, as shown in the following image.
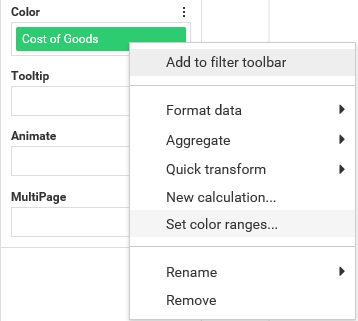
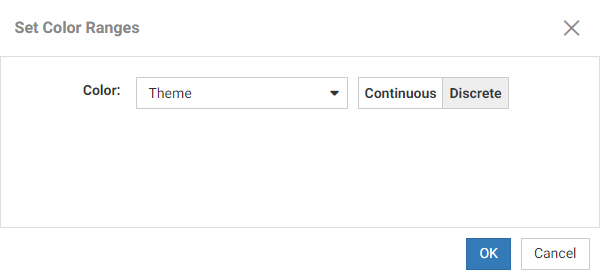
This invokes a new dialog box, Set Color Ranges, where you can select a color range for your chart, as shown in the following image.
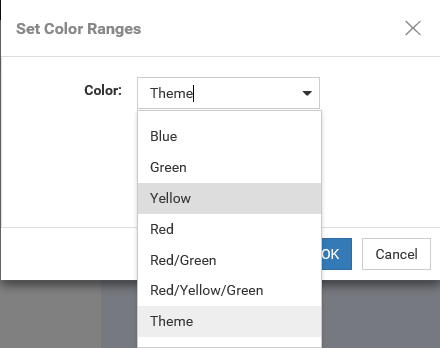
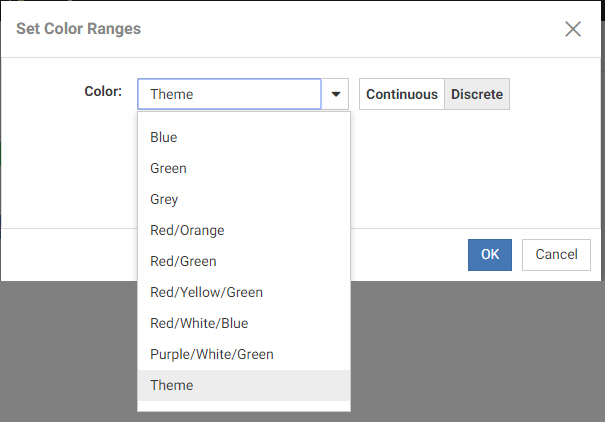
When you make a selection, you can override the color schemes that are available from the theme of your chart. Theme is selected, by default. You can select a different color range, such as Green or Red/Orange, from the list of options, which gives you more control over how color is used in your chart to create contrasts between various aspects. For example, if your chart displays different temperature values using a measure in the Color bucket, you may wish to use the Red/White/Blue option to intuitively show higher temperature values in red and lower ones in blue
If you change the color range to something other than Theme, it is written as inline styling in the .fex file. Inline styling always overrides what is in the StyleSheet because it is listed after it in the .fex file. In this case, the last setting indicates which styling takes precedence. When the color range is set back to Theme, the inline styling is removed so the behavior returns to the theme's settings.
This behavior does not affect your ability to change themes on the Format tab. However, if you change the theme with an inline setting in place, the settings of the Theme will still be overridden by the inline settings and the color scale in the legend will not be affected. The current procedure only respects the current theme's settings if the color range setting is set to Theme.
In the Set Color Ranges dialog box, you can also select Continuous or Discrete to determine how the color scale is generated. When Continuous is selected, the color scale is a gradient, and each color in the color scale represents a different value. When Discrete is selected, the color scale is divided into segments. Each color in the color scale represents a range of values.
The following image shows a matrix marker chart that uses the Red/Yellow/Green color scale with the Continuous option selected.
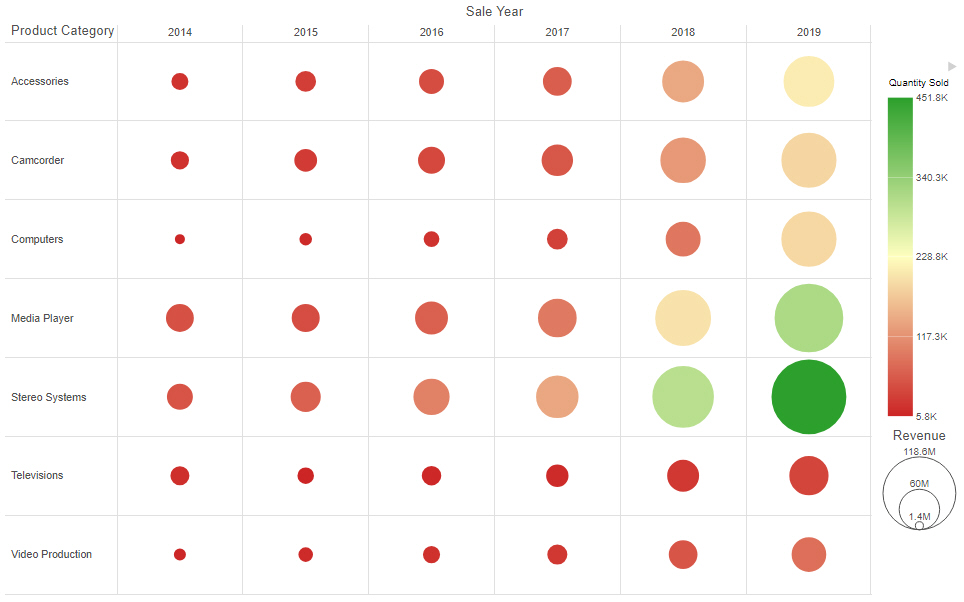
The Continuous option creates a more granular color scale, allowing you to see slight differences between similarly colored chart components.
The following image shows the same chart, with the Discrete option selected.
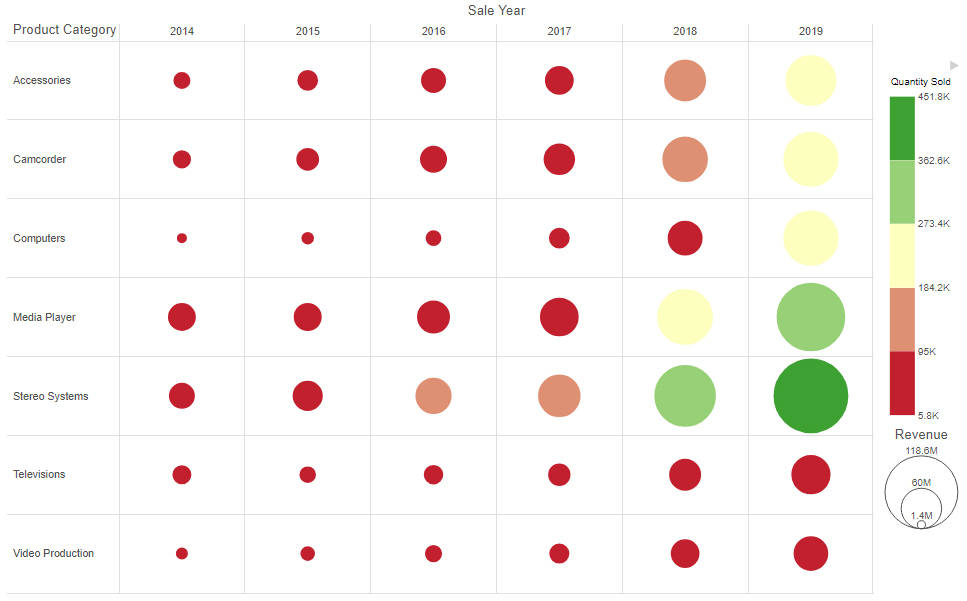
The Discrete option creates identifiable groups based on sections of the color scale.
When using the Theme color scale option, the default color scale type and number of segments in discrete mode are dependent on the values of the colorScale property in the theme that you are using. For example, if 5 colors are listed for the colorScale property in StyleSheet being used as your theme, then 5 colors display in the color scale when the discrete option is used.
Procedure: How to Add Color to Your Chart
To add color to your chart:
- Open WebFOCUS Designer. On the WebFOCUS start page, click the plus menu and then click Create Visualizations, or, on the WebFOCUS Home Page, click Visualize Data.
WebFOCUS Designer opens in a new browser tab.
- Select a workspace and a data source available from that workspace.
Once you select a data source, WebFOCUS Designer loads with options to create a single content item.
- Add one or more measures and dimensions to your chart.
- On the Format tab, expand the quick access menu and then click Axis from the drop-down list, as shown in the following image.
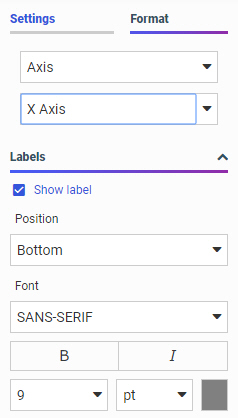
- In the Font section, click the color sample.
The color picker displays, as shown in the following image.

The text color you select is displayed for the values on the specified axis (for example, x-axis), as shown in the following image.

Procedure: How to Change the Color Scale in a Chart
- Open WebFOCUS Designer. On the WebFOCUS start page, click the plus menu and then click Create Visualizations, or, on the WebFOCUS Home Page, click Visualize Data.
WebFOCUS Designer opens in a new browser tab.
- Select a workspace and a data source available from that workspace.
Once you select a data source, WebFOCUS Designer loads with options to create a single content item.
- Add one or more measures and dimensions to your chart.
- Add a measure to the Color bucket.
Many different chart types generate a color scale from the Color bucket. Exceptions include the ring pie and data grid chart types.
- Right-click the measure field in the Color bucket and click Set color ranges.The Set Color Ranges dialog box displays, as shown in the following image.
- From the list of colors, select a color range, as shown in the following image.
- Optionally, select Continuous or Discrete to determine how the color scale is generated.
When Continuous is selected, the color scale is a gradient, and each color in the color scale represents a different value.
When Discrete is selected, the color scale is divided into segments. Each color in the color scale represents a range of values.
- Click OK.
Note the change in the color and hues in your chart.
- Release: 8207
- Category: Visualizing Data
- Product: WebFOCUS Designer
- Tags: How-to's
