Adding Column and Row Totals to a Report
You can summarize the measure data in a report by adding column and row totals. Column totals provide a grand total of each measure column in a report, while row totals provide a grand total of each row in a report, summing multiple measure values.
To add column totals to a report, on the Content section of the Settings tab of the Properties panel, click Enable column totals or Recalculate totals.
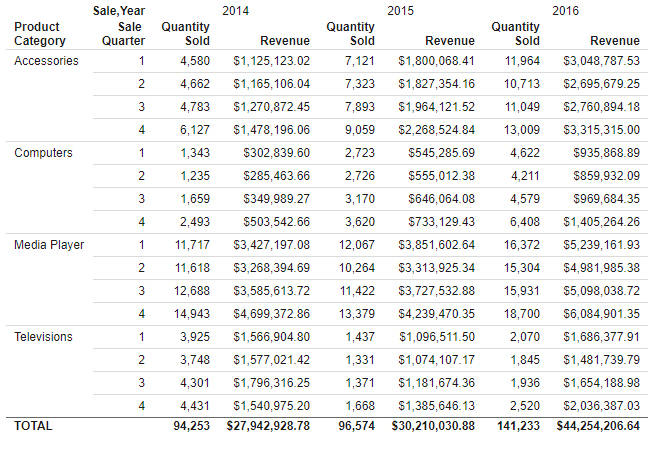
The Enable column totals option provides a sum total for each column. As shown in the following image, the values in each measure column are summed into total values. Columns created by dimension fields in the Column Groups bucket are treated as separate columns for this purpose.
Alternatively, you can use a recomputed total to provide summed totals for measure fields from the data source but recalculate the total values for computed fields created in a report. To add a recomputed total to a report, on the Settings section of the Settings tab of the Properties panel, click Recalculate totals. Values for each measure field are recomputed after each value in the selected field.
For example, perhaps you have created a report that includes a calculated field, Revenue Per Item, that is evaluated after aggregation from Revenue divided by Quantity Sold. The following image shows a report containing that field, with summed totals added using the Enable column totals option.
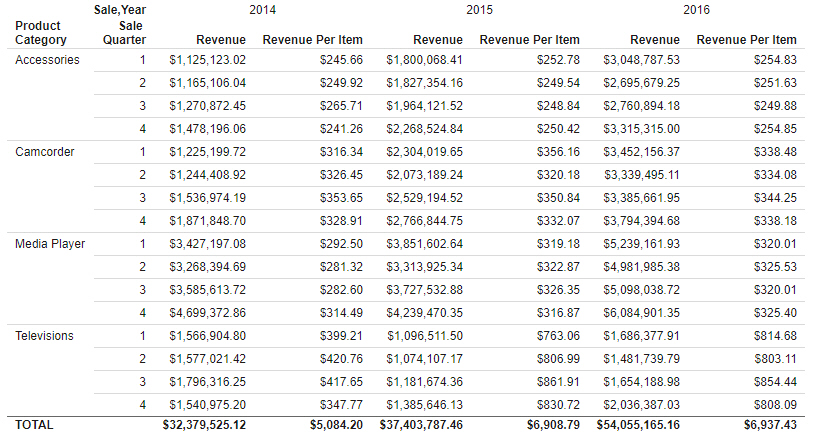
The total row contains summed values for the Revenue and Revenue Per Item fields.
By contrast, the following image shows the same report, but with recomputed totals, using the Recalculate totals option, instead.
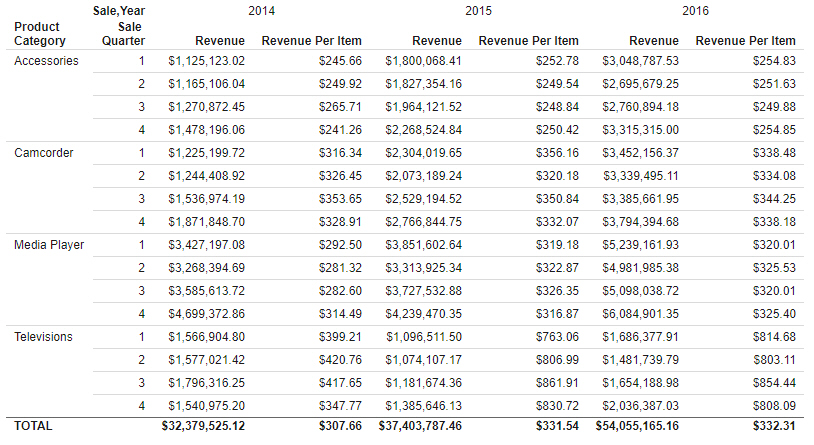
In this report, the total values in the Revenue Per Item columns are recomputed for the entire report, since Revenue Per Item is a calculated field. On the other hand, the Revenue columns are still summed, since they come from the data source.
Note that the Recalculate totals option does not reapply prefix operators. Fields with prefix operators are summed just as they would be when applying a regular subtotal. Only COMPUTE fields, which are calculated fields evaluated after data aggregation, are recalculated.
When column totals are enabled, they display below the data in the report by default. Select the Show totals above detail check box to show the column totals above the data values.
Note: The Show totals above detail option is reflected only at run-time.
You can also add row totals to a report to generate summed grand totals for each row of the report. To add row totals, on the Content section of the Settings tab of the Properties panel, click Row totals.
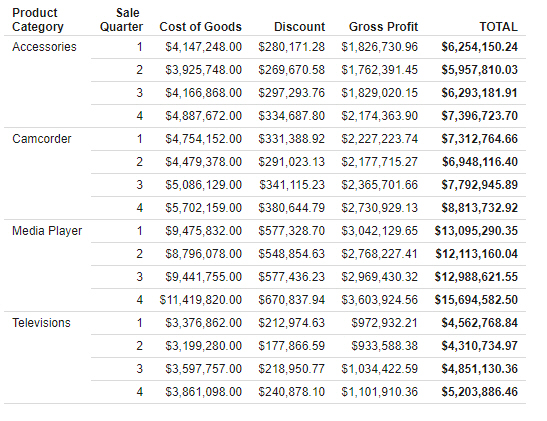
Row totals behave differently depending on whether or not fields have been placed into the Column Groups bucket. If there are no fields in the Column Groups bucket, then all measure columns in the report are summed in a single Total column, as shown in the following image.
If there is a field in the Column Groups bucket, then instead of summing all columns, the row totals are evaluated for each measure field in the report, as shown in the following image.
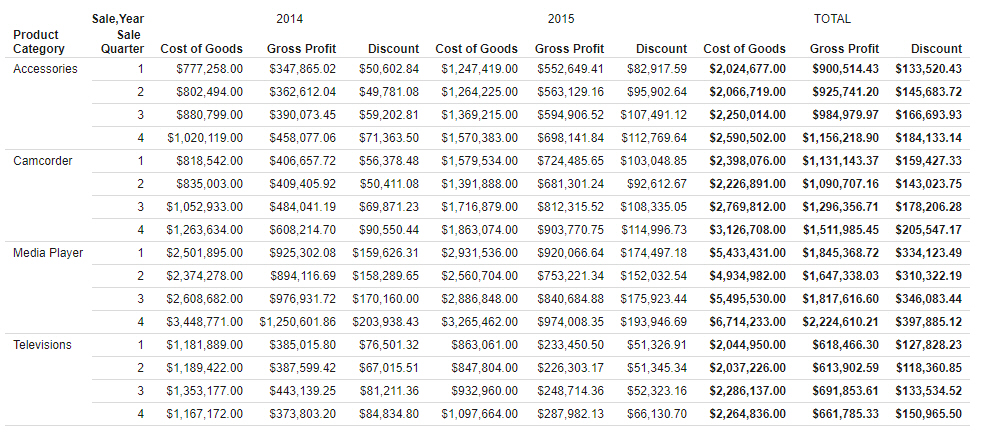
Note that row totals provide sum values for the measures in each row, including instances when the report includes calculated fields.
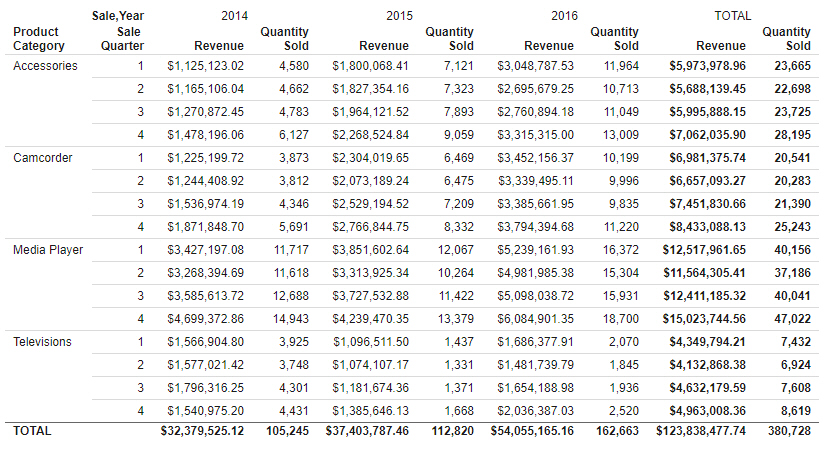
If your report includes both column totals and row totals, then column totals are evaluated for any row total columns, as shown in the following image.
- Release: 8207
- Category: Visualizing Data
- Product: WebFOCUS Designer