Adding Filters to Content
As you create charts or styled tabular content in WebFOCUS Designer, you may want narrow the display of information that is shown. You can do this by creating filters with data fields in your content. You can also use filters as a way to create custom displays of the data that you show in your content. For example, you may only want to show revenue information for specific product categories and models in a given year.
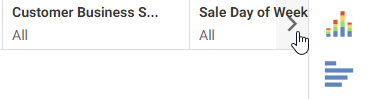
When you add filtered content to a page, the filters automatically appear on the page, and provide interactive controls that your users can choose from to change the view of data available to them. Filtered content can also be kept stand-alone, and you can choose to enable parameter prompting, which requires a user to make a selection before the content displays. There is no limit to the number of filters that you add, however, as you add more than five filters, all filters may not fit on your screen. You can use the arrow control to scroll over to see any filters that are not visible in the Filter toolbar, as shown in the following image.
You can add filters to a chart or styled tabular content in one of the following ways:
- Drag a data field to the filter toolbar above the canvas.
- Right-click a data field, and click Add to filter toolbar.
Note: You can add data fields to the filter toolbar even if you do not have it displayed in your view.
You can remove filters from the filter toolbar by clicking the X in the upper-right corner of the filter, or by right-clicking the filter and then clicking Delete.
Once you have created filters, you can edit them further to customize the data values and selection options that are available for each filter control. For example, when you create a filter using a dimension and open the control on the Filter toolbar, it lists the available data values. You can then select the data values that you want a user to choose from, as shown in the following image.
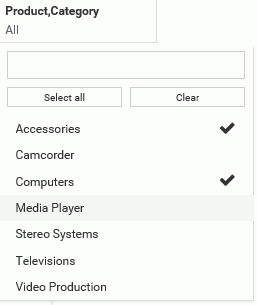
By default, the list filter control does not select any data values, and gives users the option to choose any value that is available. To select data values, you click the filter control, and begin clicking the data values that you want to add, then click outside the filter control area to apply the selection.
If you select one or two values, each selected value is listed by name in the filter control. If you select three or more values, the filter control shows the number of values selected out of the total number of available values. If all values are selected, the filter control says All.
The selected values are displayed in the chart at run time by default, and users can select other values to display them.
You can also choose to exclude data values from the list. To do this, right-click the filter, and click Exclude. You can then click the filter control again, and begin clicking the data values that you want to exclude from the list. Once you have selected the data values that you want to exclude, your chart refreshes.
At run time, instead of choosing which values to display in the chart, users select values to exclude from the chart.
You can also set the filter to use a single value instead of multiple values. If you right-click a filter and click Single, when you click the filter control again, you are only able to select a single value.
If you add a filter using a numeric field, such as a measure, (for example, Cost of Goods), you can use a slider to adjust the range of data values that display, as shown in the following image.
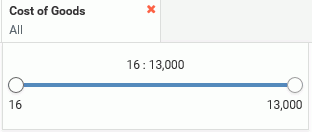
Click the filter, and use the slider options on either side to modify the range of data values. You can set a range using both ends of the slider.
The filter for a numeric field is a WHERE TOTAL filter. That means that the filter is applied after aggregation for all sort values in the chart instead of filtering each row of the data source before aggregation.
If you right-click a numeric filter and select Greater than or equal or Greater than, you can select a minimum value to display. The upper limit on the slider is fixed and cannot be moved. Selecting Greater than or equal includes the value indicated by the slider in the filter, while selecting Greater than excludes this value. Similarly, if you right-click a numeric filter and select Less than or equal or Less than, you can select a maximum value to display. The lower limit on the slider is fixed and cannot be moved. Selecting Less than or equal includes the value indicated by the slider in the filter, while selecting Less than excludes this value. The slider displays the greater than (>), less than (<), greater than or equal to (≥), and less than or equal to (≤) symbols to differentiate your choices.
Note: Selecting the full range of values in the slider includes all values in the filter. The value indicated by the slider head is not excluded in this case, even if the Greater than or Less than filter options are used.
If you add a date field, you can use the date picker window to select a start or end date, range of dates, and more, as shown in the following image.
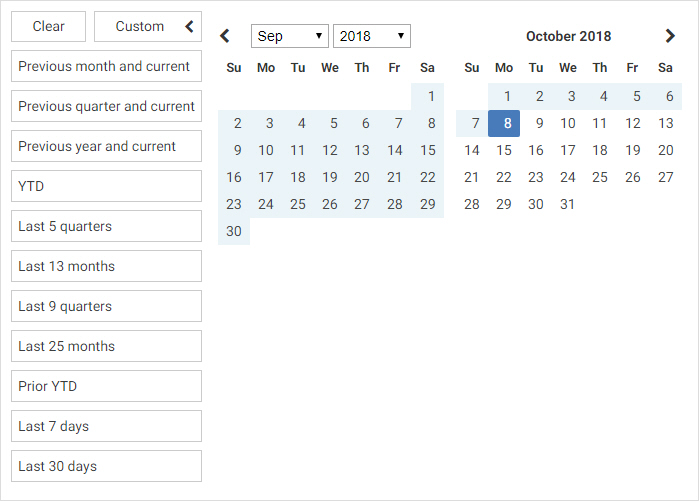
If you right-click a date filter and click After or Before, you are unable to select a range using either the preset or custom range options. Instead, use the calendar to select a start or end date for the filter.
Similar to filtering a numeric field, you can use the On or after and On or before options as an alternative to After or Before to include the start or end date selected in the calendar. The After and Before options do not include the selected date.
In addition to the options specific to each type of filter, you can right-click any filter and click Require selection to make the filter required. When a filter is required, the chart will not load until the user makes a selection for that filter.
- Release: 8206
- Category: Creating Content
- Product: WebFOCUS Designer
- Tags: How-to's