Adding Filters to a Visualization
As you create charts and styled tabular content in WebFOCUS Designer, you may want narrow the display of information that is shown. You can do this by creating filters for fields in your data source. You can also use filters as a way to create custom displays of the data that you show in your content. For example, you may only want to show revenue information for specific product categories and models in a given year, or for product categories that exceed a certain revenue value.
Filters in WebFOCUS Designer can utilize one of two behaviors: static and prompted filtering. Static filters are applied to individual content items at design time, and allow you to apply consistent filter values to a chart or report. Prompted filters, on the other hand, allow users to select the filter values to use in your content at run time. When you create a new prompted filter, it affects all new content on the page. In addition to adding prompted filters to new content, when existing content using a prompted filter is added to a page, you can create automatic filter controls that can be used at run time. Any content that uses the same parameters can be filtered using the same control. These controls are not generated for static filters.
To create a static filter for a selected field, drag it from the Fields tree on the Resources panel to the Filter bucket, which is located below the field container buckets on the Properties panel when you select a content item. When you create a static filter, the Add Filter dialog box appears, as shown in the following image.
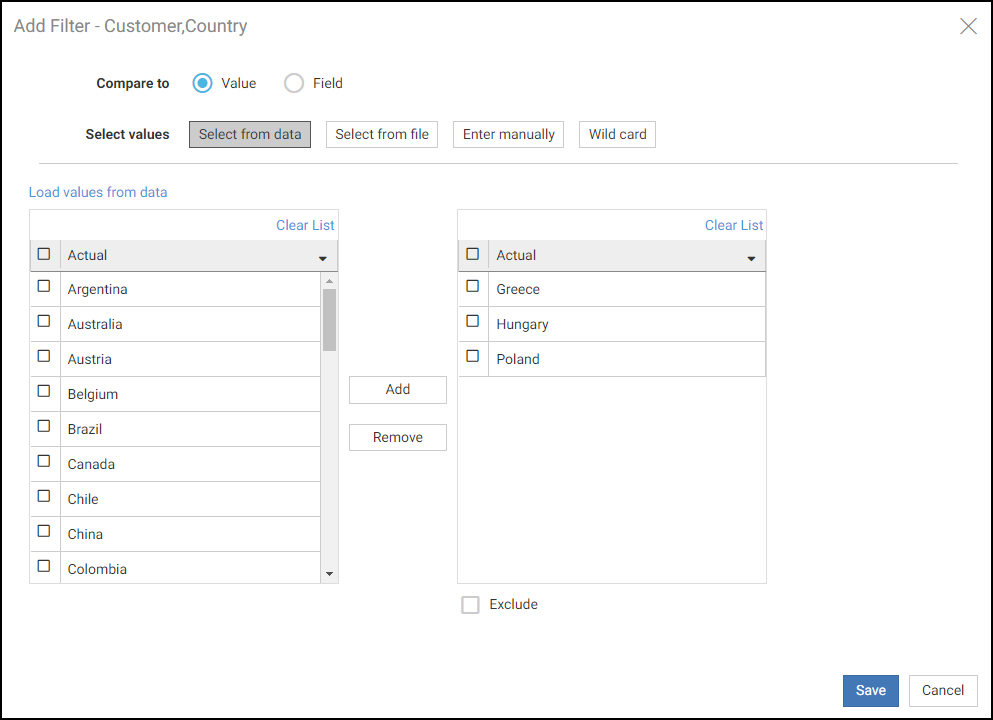
You can select filter values and the relationships those values have to the data that you want to display in your chart or report. Static filters can only be created for new content.
You can add prompted filters to a visualization using new or existing content in one of the following ways:
- When creating new content, drag a data field to the Filter toolbar below the page toolbar.
- When creating new content, right-click a data field and click Add to filter toolbar.
- When creating or interacting with new content, select one or more sections of a chart by clicking or lassoing them, then click Keep.
- When creating or interacting with new content, use the filter options in the In-Document Analytics menu on the column of a report.
- When creating a visualization from existing content, add an item that uses dynamic parameter filters to the visualization.
Click the resulting label on the Filter toolbar to open a control, from which you can select default filter values. Users will be able to change the selected value at run-time.
- Release: 8207
- Category: Visualizing Data, Adding Content to Pages
- Product: WebFOCUS Designer