Changing Output Formats in a Chart or Report
The output format of your content determines the type of file that is generated when that content is run. Different output types enable different levels of run-time interactivity, embedding behavior, and compatibility with outside programs, so you can change the output type depending on how you intend to use your content and who the intended audience is.
You can change the output format for stand-alone charts and reports. Charts and reports created as part of a multi-content visualization use the Interactive output format, which provides run-time features such as tooltips, drill-downs, and on-chart filtering.
To change the output format of a stand-alone chart or report created in WebFOCUS Designer, use the Output Format menu on the Visualization toolbar. The Output Format menu is shown in the following image:
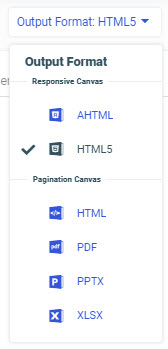
The following output format options are available:
- AHTML
- HTML5
- HTML
- PPTX
- XLSX
At design time, the AHTML and HTML5 output formats use the responsive canvas. When using the responsive canvas, reports present In-Document Analytic paging controls at the bottom of the canvas that allow you to navigate through the pages of report. Some report styling properties are unavailable when using the responsive canvas. Charts in the AHTML and HTML5 output formats present informational tooltips and allow on-canvas filtering at design time.
The HTML, PDF, PPTX, and XLSX output formats use a paginated canvas at design time. Some report styling properties are only available when using the paginated canvas. You can scroll through an entire report using a scrollbar. Charts using the paginated canvas do not present interactive options, such as tooltips.
At run time, the HTML5 and HTML output formats are functionally equivalent. The two options are available to allow you to use the two different canvas types.
When you run your content, the HTML, HTML5, and AHTML options are browser-based formats, while PDF, PPTX, and XLSX output can be downloaded, distributed, and opened using standard office suite software. The Select at runtime option provides the ability to run a chart using any of the other output formats. Users can select a format at runtime from a filter control.
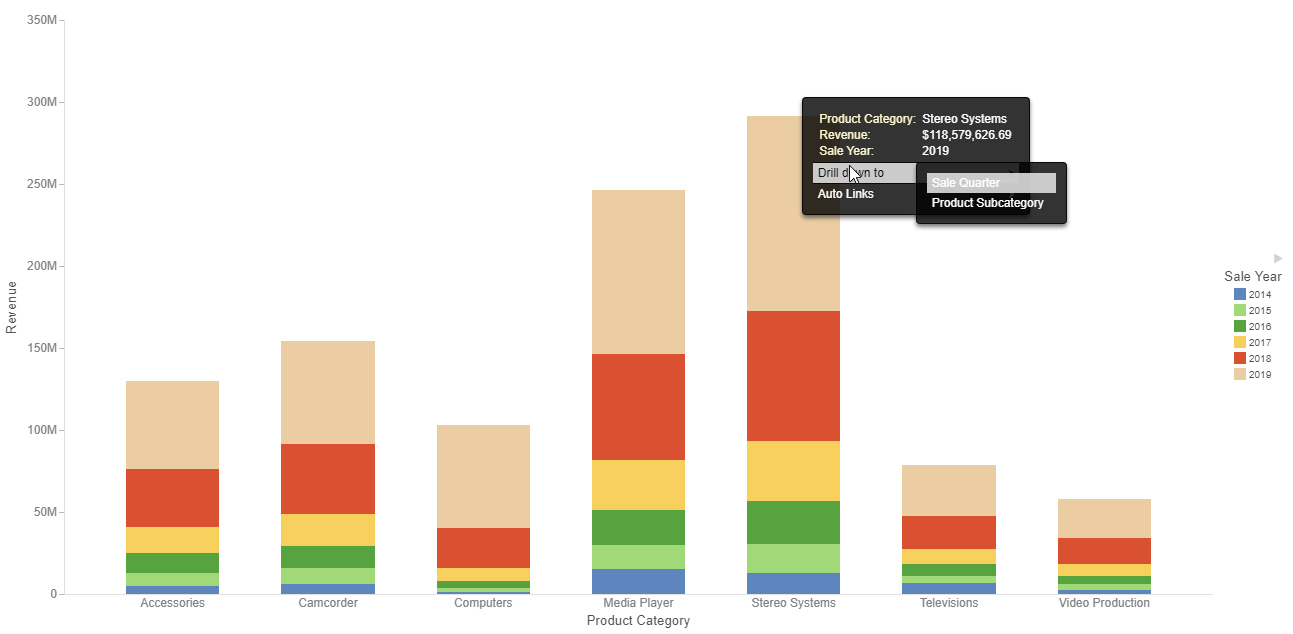
When creating a chart, the HTML and HTML5 output formats generate a basic chart, enhanced with JSON objects, that can be run in a web browser. The HTML and HTML5 chart formats automatically generate tooltips for different sections of a chart, allowing you to see detailed information at run-time on top of the quick, broad intuitions that a chart communicates. These tooltips provide run-time access to interactive features such as Auto Drill, which allows you to drill into data hierarchies used in the chart, and Auto Linking, which allows you to connect content that uses shared parameters associated with sort fields in the chart. The following image shows a chart that uses the HTML5 output format and has Auto Drill and Auto Linking options available from the tooltip.
The HTML5 format also enables you to run your chart with Insight, which allows you to modify, filter, and reformat a chart at run-time.
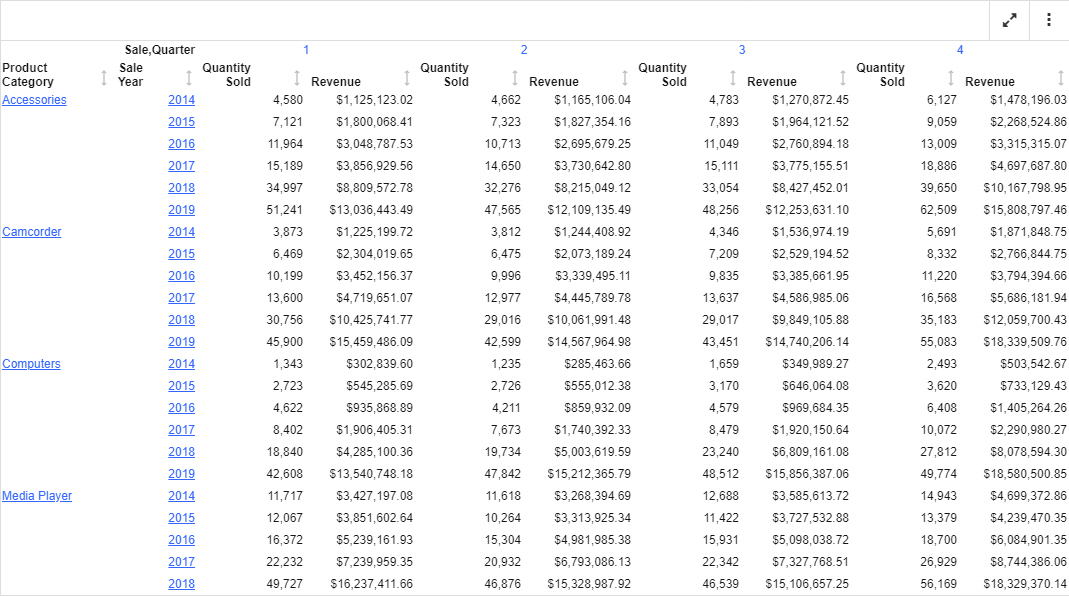
When creating a report, meanwhile, the HTML and HTML5 output formats generate a basic report that can be run in a web browser. The simplicity of the HTML and HTML5 output formats make them extremely flexible. Run-time interactivity is available in the form of hyperlinks, which provide access to Auto Drill and Auto Linking. An example of an HTML report with Auto Drill hyperlink behavior is shown in the following image.
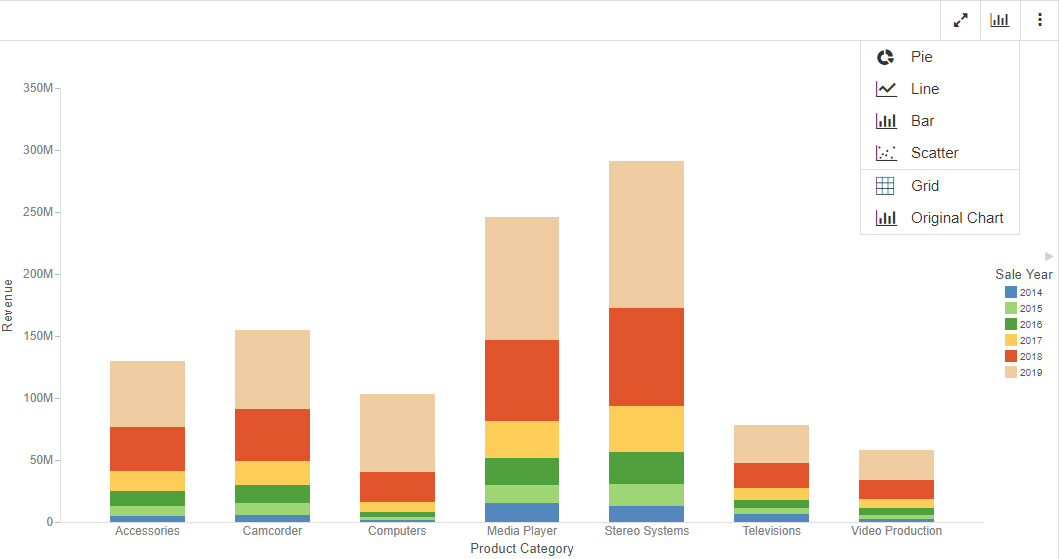
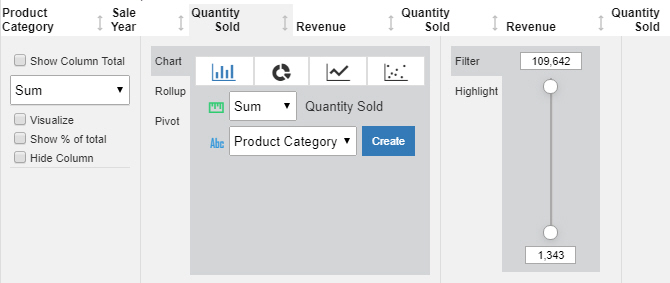
Charts and reports using the AHTML format can also be run in a web browser. AHTML is a format that allows you to perform offline analysis using in-document analytic features. The AHTML format allows you to use Auto Drill and Auto Linking functionalities just like HTML. In addition to this, AHTML enables numerous features that allow you to reorganize and explore the data in an analytic chart without directly accessing the data source on which it is based. This includes the ability to filter the chart by lassoing values, view the data in the chart as a different chart type using the Chart Types menu, and create a new chart using the same fields while still in run time, download the chart, and more using the Options menu. An analytic chart with the Chart Types menu open is shown in the following image.
When the AHTML format is used in a report, in addition to the Options menu above the report, you can click a column header to filter the report, view the data in the report as a chart, and more. A menu of options appears, allowing you to explore and transform the report, as shown in the following image.
You can also click the arrows above each column header to sort the report by the values in that column.
When a chart or report using the AHTML output format is added to an assembled page, the Options menu becomes part of the container toolbar. It allows you to access the Chart/Rollup Tool to create new content from the same set of fields used in the original content, move the fields in a chart to different buckets, export, save, or print your content, and more.
To access your content in common desktop tools, use the PDF, PPTX, or XLSX output formats.
When you run content that uses PDF, PPTX, or XLSX as the output format, a file is created in a .pdf, .pptx, or .xlsx format, respectively. The file opens in a browser viewer for that file type or is downloaded in the browser. The file can be opened using a tool compatible with the output file type. When the item is a chart, an image of the chart is embedded in the file. If the tool allows it, you can then right-click the image of the chart to save it as a separate image file.
Certain features may not be available, depending on the file type. For example, the PDF, PPTX, and XLSX output formats do not support Auto Linking, Auto Drill, or any other tooltip-based behavior, since a single, self-contained file is created.
Separate pages generated by page breaks or by the MultiPage bucket also behave differently, depending on the output file type. In PDF, a separate page is created for each page break or multipage value, and in PPTX, a separate slide is created. In Excel, however, separate pages are output to the same worksheet, similar to how page breaks and multipage values display in the HTML output format.
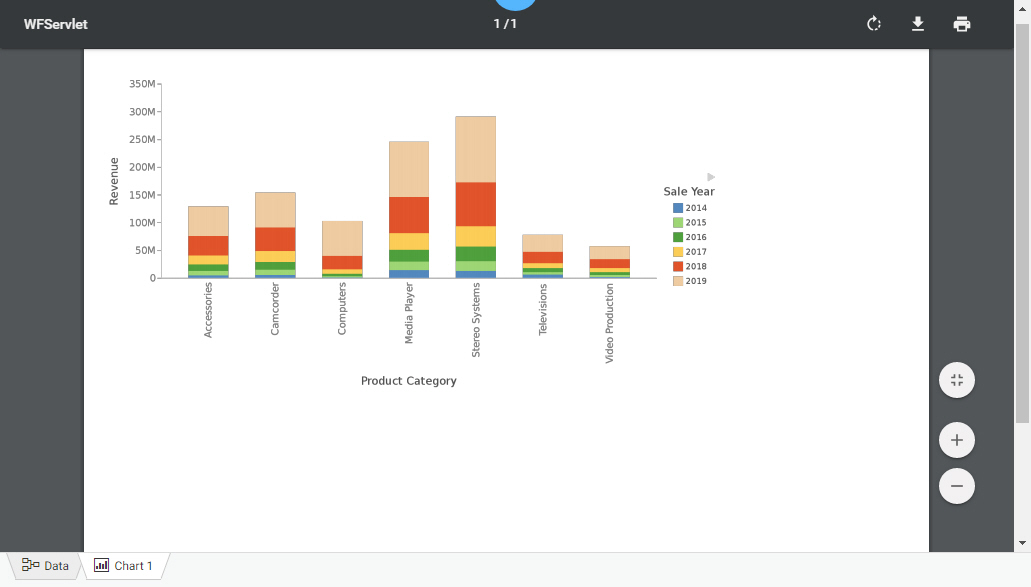
The following image shows an example of a chart created using the PDF output format viewed in a web browser.
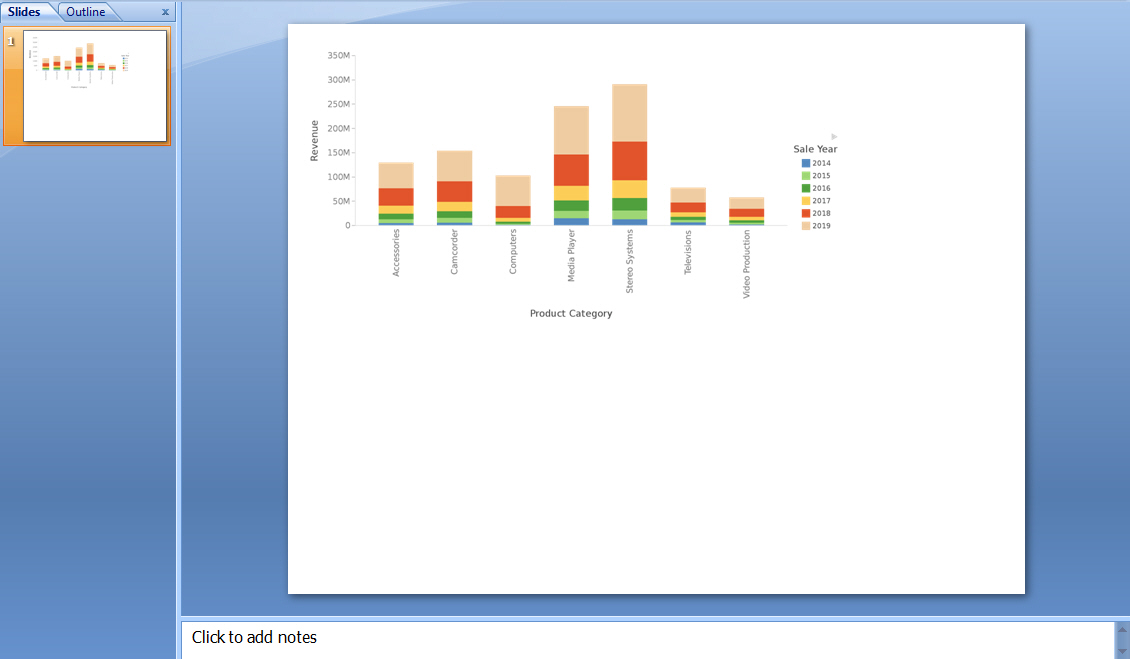
The following image shows an example of a chart created using the PPTX output format viewed in Microsoft PowerPoint 2007.
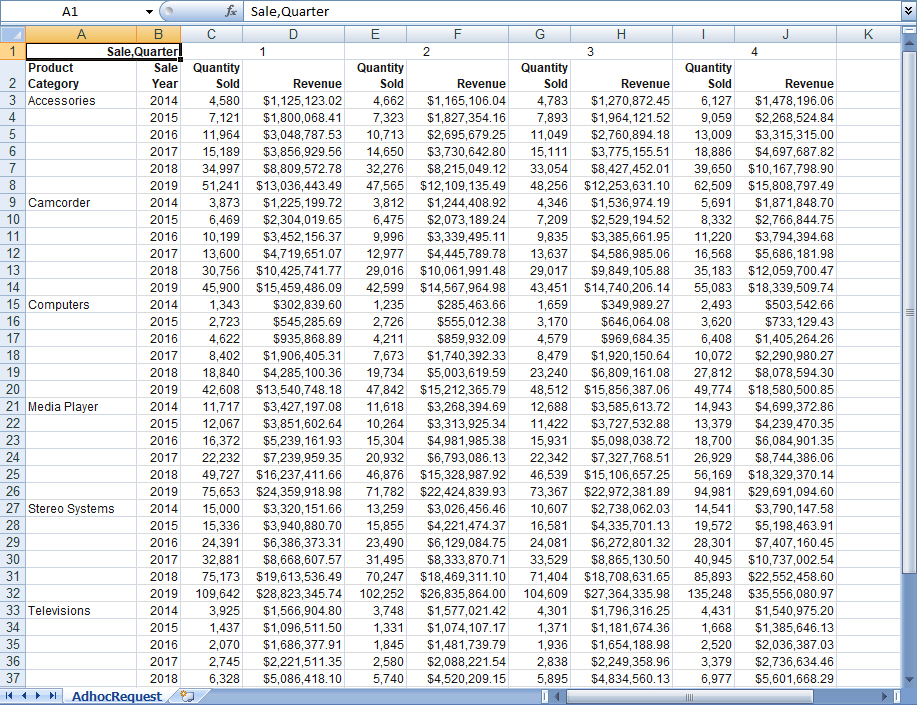
The following image shows an example of a report created using the XLSX output format viewed in Excel 2007.
- Release: 8207
- Category: Visualizing Data
- Product: WebFOCUS Designer