Creating Maps to Illustrate Trends
You can create maps to identify patterns or trends in your data. By converting data into values that can be displayed on a map, you are able to visualize scenarios, illustrate hot spots, and identify potential problem areas. For example, a law enforcement agency may use mapping functionality to identify areas of higher crime within the locations they cover. You can also use maps to determine how places are related, understand where things are located, and identify the best actions to take. By illustrating trends on a map, a decision maker can identify patterns easily, and reach conclusions sooner.
You can access Map options from the Format tab, as a special tab is activated when a map is initiated. This tab is shown in the following image:
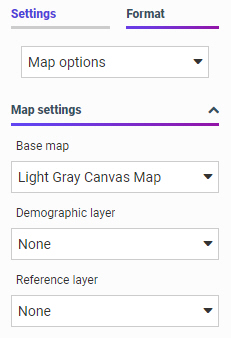
You can format maps to display areas of emphasis through the use of demographic and reference layers.
- Release: 8207
- Category: Visualizing Data
- Product: WebFOCUS Designer