Creating Reports
You can create reports in a visualization in WebFOCUS Designer similar to the way in which you create charts. Reports allow you to communicate information at a high level of detail using a familiar tabular format. You can create a stand-alone report in a visualization, or combine multiple reports in a page.
You can create a report by creating new content in a visualization and changing the content type to a report using the Content picker. The report options in the Content picker are shown in the following image.
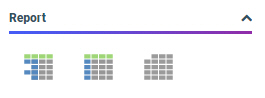
Three report layout options are available: a standard, tabbed report in which repeating sort values are only displayed once, a grid in which sort values repeat so that all cells of the report are filled. The third option creates a data grid, which is a type of chart that resembles a tabbed report.
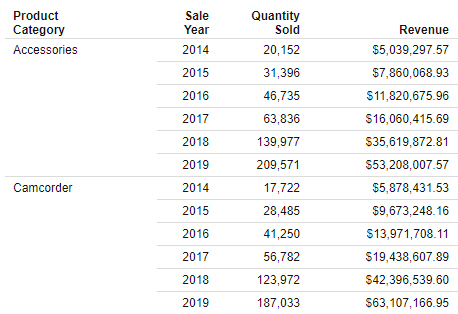
The following image shows a report using the standard report layout.
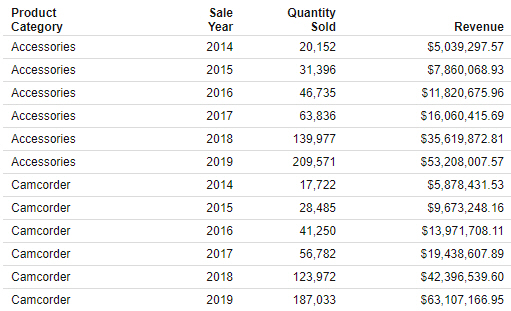
The following image shows a report using the grid layout.
To populate the report, select measures and dimensions from the Resources panel with the Fields tab selected from the sidebar. The Resources panel displays the fields that were populated from your data source. You can add fields to your report in the following ways:
- Drag a field from the Fields tab into your content.
- Double-click a field in the Fields tab.
- Drag a field from the Fields tab into a bucket.
- Right-click a field on the Fields tab and click Add to report.
When you add a field to your report, the canvas updates to display the values in it.
You can define the rows and columns in a report by adding fields to the Rows and Columns buckets, respectively. Typically, these are dimension fields. The values in these fields are used to sort the report.
You can display aggregated values in a report by adding fields to the Summaries bucket. This bucket is usually used to display values for measure fields. The Summaries bucket displays by default, but you can change the bucket by selecting a different display option. The available display options are shown in the following image.
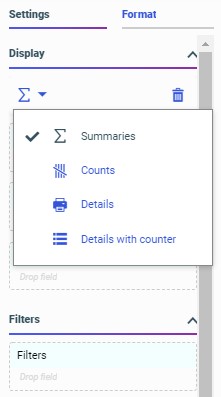
The Summaries and Counts options provide aggregated measure values for each sort value, that is, each row or column, in the report. The Details and Details with counter display options, on the other hand, provide a complete list of every value for the selected field or fields.
Once you have added fields to the report, you can format it to enhance its appearance or style. For example, you might want to add a header and footer to identify the information on each page of the report, or use a report template to modify the layout. You can also click the Format tab to apply a theme or change the output format of the report.
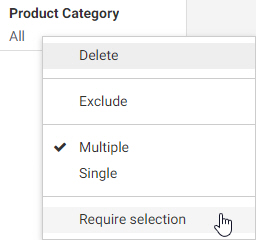
You can filter a report using prompted or static filters. To create a prompted filter, drag a field from the Fields tab to the Filter toolbar. A menu appears, allowing you to select default filter values. When a report with prompted filters is added to a visualization assembled from existing content, you can create filter controls to allow users to select their own filter values at run time. When creating a report, you can also require user selection for a prompted filter, so that the report does not run until the user makes a filter selection, by right-clicking the filter in the toolbar and clicking Require selection, as shown in the following image.
Static filters, on the other hand, do not allow user selection at run-time. They allow you to apply consistent filters to the report that cannot be modified at run time. To create a static filter, drag a field from the Fields tab to the Filters bucket, then specify filter values in the Add Filter dialog box.
Procedure: How to Create a Report Using WebFOCUS Designer
- Open WebFOCUS Designer. On the WebFOCUS start page, click the plus menu and then click Create Visualizations, or, on the WebFOCUS Home Page, click Visualize Data.
WebFOCUS Designer opens in a new browser tab.
- Select a workspace and a data source available from that workspace.
Once you select a data source, WebFOCUS Designer loads with options to create a single content item.
- On the Content picker, select a report layout.
- Add sort fields to the report by dragging dimension fields from the Fields pane into the Rows and Column Groups buckets.
Note: You can also double-click a dimension field or drag it onto the canvas to add it to the Rows bucket.
- Add aggregated data values to the report by dragging measure fields from the Fields pane into the Summaries bucket.
Note: You can also double-click a measure field or drag it onto the canvas to add it to the Summaries bucket, or other measure bucket if you have changed the display option.
The report displays the selected fields, based on the bucket they were placed in.
- The following are some of the options you have to customize the report:
- Select a theme from the Format tab.
- Change the layout of the report by changing the report template from the Content picker.
- Filter the report by dragging fields into the Filter toolbar or Filters bucket.
- Add subtotals, page breaks, or row breaks to the report each time the value in a field changes by right-clicking a field in the Properties panel, pointing to Insert breaks, and selecting an option for each category.
- Add a header or footer by selecting the header or footer area of the report and typing header or footer text.
- Enable Auto Drill or Auto Linking, or make the report an Auto Link target, from the Content section of the Settings tab on the Properties panel.
- Add column or row totals to the report from the Settings section.
- To see a run-time view of the report, including behaviors such as Auto Drill or dynamic filtering that are not available in the canvas, click Run in new window
 on the Visualization toolbar.
 - On the Designer toolbar, click Save to save your report to a selected location. Once saved, you can share the report and add it to a page.
To open the report to edit it again at a later time, locate it on the WebFOCUS start page Home Page, right-click it, and click Edit from the shortcut menu.
- Release: 8207
- Category: Visualizing Data
- Product: WebFOCUS Designer
- Tags: How-to's