Displaying Measure Values in Reports
When you add a measure field to a report using the Summaries bucket, the values in that field are aggregated, by default. This means that measure values are evaluated for each sort value in the report. This option is used when the Summaries display option ![]() is selected.
is selected.
By default, the values of fields in the Summaries bucket are aggregated by summing them. You can also aggregate them by average, count, count distinct, percent, percent of count, minimum, maximum, median, and mode values. To use one of these aggregation options, right-click a field in the Summaries bucket, point to Aggregate, and select an aggregation.
You can change the display method for measure values from Summaries to Counts, Details, or Details with counter to change how the fields in this bucket are evaluated. These display methods are available from the Calculation Options menu above the buckets on the Display tab, and in the menu next to the measure bucket – the Summaries bucket, by default – as shown in the following image.
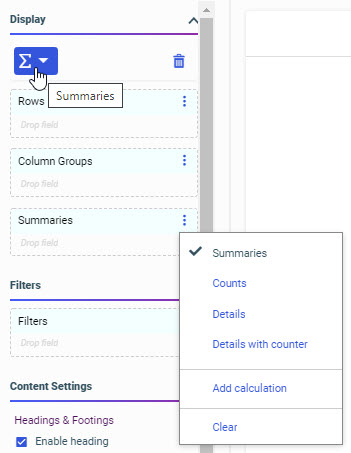
Changing the display method also changes the name of the Summaries bucket.
You can use the Counts ![]() display option as an alternative to the Count prefix operator aggregation option to provide a count of data records for all fields in the Count bucket. A count allows you to see the distribution of your data by displaying the number of records in the selected Count fields, for each sort value.
display option as an alternative to the Count prefix operator aggregation option to provide a count of data records for all fields in the Count bucket. A count allows you to see the distribution of your data by displaying the number of records in the selected Count fields, for each sort value.
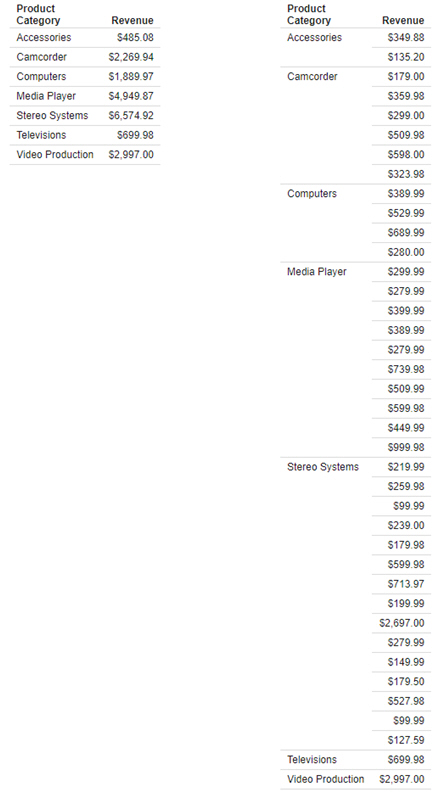
You can select the Details display option ![]() to individually display all record values for the fields in the Display bucket instead of aggregating them.
to individually display all record values for the fields in the Display bucket instead of aggregating them.
For example, the following image shows two reports. The one on the left uses the default Summaries display option, while the one on the right uses the Details display option.
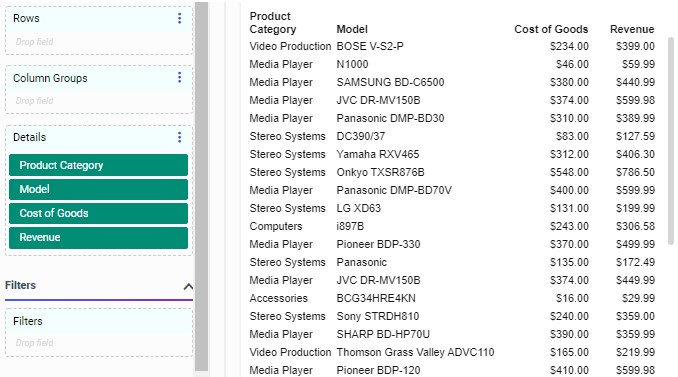
Records in a Details field are separated into groups based on the fields in the Row and Column Groups buckets, but are not individually sorted. The order in which they appear reflects the order in which they are accessed from the data source.
To see a list of the records in your data source without grouping them, for example as a data extract, you can add all desired dimension and measure fields to the Detail bucket, as shown in the following image.
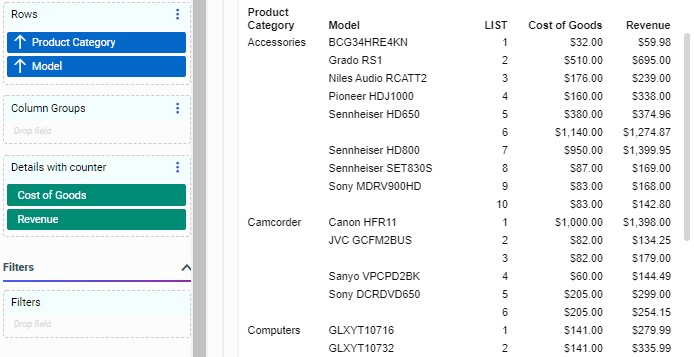
You can also use the Details with counter display option ![]() to display individual values in the report and number them. This can be useful if you want to display records from your data source and provide a key value, such as a record ID number, for each one, as shown in the following image.
to display individual values in the report and number them. This can be useful if you want to display records from your data source and provide a key value, such as a record ID number, for each one, as shown in the following image.
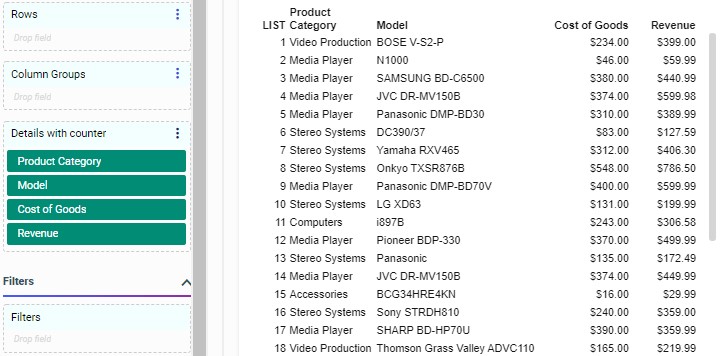
When there are fields in the Rows bucket, the Details with counter display option generates a numbered list based on the primary sort field, but places it before the measure columns in the report. Notice that in the following image, the report is sorted by Product Category and Model, so the record list column appears to the right of the Model column, but the counter resets only on each Product Category value.
Since the Details and Details with counter display options create a row in the report for every record in the data source, be careful when using them with larger data sources.
- Release: 8207
- Category: Visualizing Data
- Product: WebFOCUS Designer