Generating a Data Extract or Image From Content
In addition to the output formats that you can use when running your content, you can export a snapshot of a single chart or report as a data extract in an Excel spreadsheet, or as a .png image, which are downloaded from your browser. This allows you to quickly generate a representation of your content at any time, in a format that can be easily saved and distributed.
To generate the image or data extract, click the Application menu and, in the Export As section, click Data or Image. The file is downloaded using your browser.
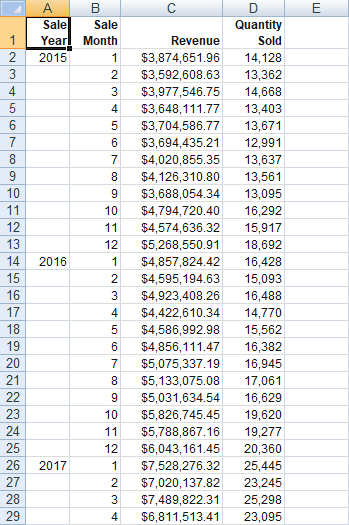
When you export a data extract of your chart or report, it is downloaded as an Excel spreadsheet with the data displayed as a tabular report. This can help identify the precise values that are graphically represented in your chart. A spreadsheet is also easy to distribute. The following image shows part of the spreadsheet created by exporting a treemap chart as a data extract.
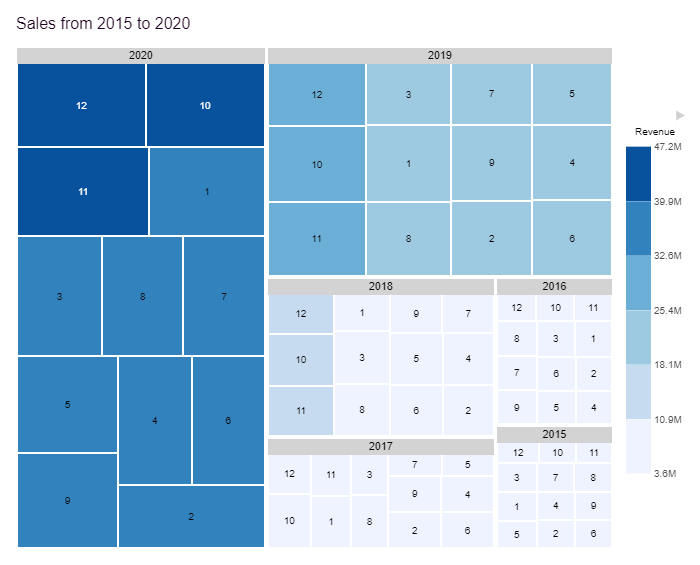
When you export an image, a snapshot of the item is taken as it currently exists, and saved in .png format. Headers, footers, and legends are included in the image, but external items such as filter controls are not. The following image, showing a treemap chart, was exported directly from WebFOCUS Designer.
Once exported, you can open the image using a program on your machine capable of opening .png images, distribute the image, and even use it as a thumbnail for your content once you save it. To set a thumbnail, right-click the saved chart or report on the WebFOCUS start page or Home Page and click Properties. On the Advanced tab, select the Embedded thumbnail option and browse to the location where the exported image was saved. The thumbnail makes it easier to identify a content item on the WebFOCUS start page or Home Page, or in the Resources tree when assembling a visualization in WebFOCUS Designer.
- Release: 8207
- Category: Visualizing Data
- Product: WebFOCUS Designer