Generating a Statistical Box Plot Chart
A box plot shows a series broken down into quartiles for each group value. In a box plot, each series and group requires five values. For a given series and group box, the first value is the minimum (lower hat or whisker), the second defines the box bottom (first quartile), the third value is the median (second quartile), the fourth value defines the box top (third quartile), and the fifth value defines the maximum value (top hat or whisker). Outliers are drawn as separate points.
The statistical box plot chart type calculates the five values, given one or more measures and one dimension.
Box plot fill color and border are defined by the series color and border. The series marker properties control the appearance of outlier points.
The chart type is STAT-BOXPLOT. STAT-BOXPLOT attribute categories are:
- x-axis for the sort field (dimension).
- y-axis for the series fields (measures).
Generating a Statistical Box Plot Chart
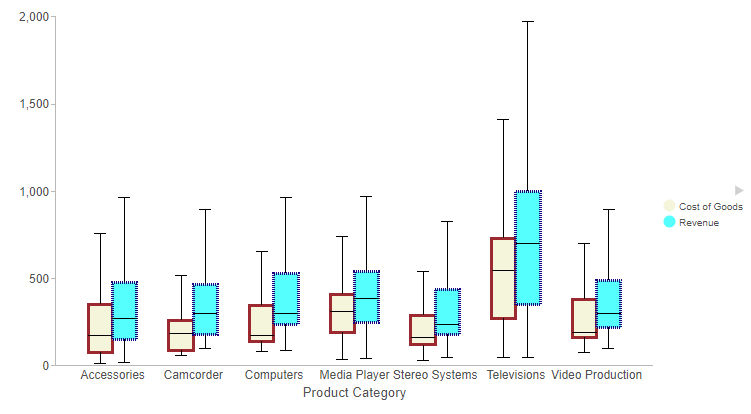
The following request generates a statistical box plot with two measures. The series properties specify the box fill colors and borders.
GRAPH FILE wf_retail_lite
PRINT COGS_US REVENUE_US
BY PRODUCT_CATEGORY
ON GRAPH PCHOLD FORMAT JSCHART
ON GRAPH SET LOOKGRAPH <b ast:aid="00000023WIGC00F652020D1GYZ" ast:anno="can">STAT-BOXPLOT</b>
ON GRAPH SET STYLE *
INCLUDE=IBFS:/FILE/IBI_HTML_DIR/ibi_themes/Warm.sty,$
type=data, column=product_category, bucket=x-axis, $
type=data, column=cogs_us, bucket=y-axis, $
type=data, column=revenue_us, bucket=y-axis, $
*GRAPH_JS
"axisList":{
"y1": {"max": 2000, "min": 0}},
"series":[
{"series":0, "color": "beige", "border": {"color": "brown", "width": 3}},
{"series":1, "color": "cyan", "border": {"color": "navy", "width": 3, "dash": "1 1"}}]
*END
ENDSTYLE
END
The output is shown in the following image.

Generating a Statistical Box Plot With Outliers
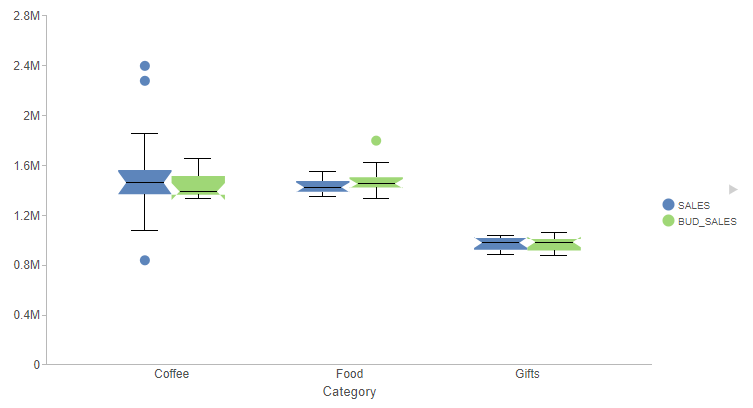
The following request generates points that do not fall within the statistical measures of the boxes.
DEFINE FILE GGSALES
SALES/D12 = IF ((CATEGORY EQ 'Coffee') AND (STCD EQ 'R1019')) THEN 19000
  ELSE IF ((CATEGORY EQ 'Coffee') AND (STCD EQ 'R1020')) THEN 20000
  ELSE IF ((CATEGORY EQ 'Coffee') AND (STCD EQ 'R1040')) THEN 7000
  ELSE DOLLARS;
BUD_SALES/I12 = IF ((CATEGORY EQ 'Food') AND (STCD EQ 'R1019')) THEN 15000 ELSE BUDDOLLARS;
END

GRAPH FILE GGSALES
SUM SALES
BUD_SALES
BY CATEGORY
BY STCD
ON GRAPH PCHOLD FORMAT JSCHART
ON GRAPH SET LOOKGRAPH STAT-BOXPLOT
ON GRAPH SET STYLE *
INCLUDE=IBFS:/FILE/IBI_HTML_DIR/ibi_themes/Warm.sty,$
type=data, column=n1, bucket=x-axis, $
type=data, column=n2, bucket=detail, $
type=data, column=n3, bucket=y-axis, $
type=data, column=n4, bucket=y-axis, $
*GRAPH_JS
"series": [{"series": 0, "marker": {"visible": true}},
           {"series": 1, "marker": {"visible": true}}],
"boxPlotProperties": {
  "notch": {"width": "70%"}
}
*END
ENDSTYLE
END
The output is shown in the following image. The outliers are the individual points that display above and below the boxes.

How to Configure Box Plot Chart Properties
The following properties can be used to format box plots and statistical box plots.
"boxPlotProperties": {
        "hatWidth": "string",
        "drawHatAsBox": boolean,
        "notch": {
            "width": "string",
            "multiplier": number
        },
        "medianLine": {
            "width": number,
            "color": "string",
            "dash": "string"
        },
        "connectorLine": {
            "width": number,
            "color": "string",
            "dash": "string"
        },
        "meanMarker": {
            "visible": boolean,
            "color": "string",
            "border": {
                "width": number,
                "color": "string",
                "dash": "string"
            },
            "size": number,
            "shape": "string",
            "rotation": number,
            "tooltip": "string"
        }
    },
where:
"hatWidth": width
Can be a number that defines the width of the hat in pixels or a string that includes a percent symbol, enclosed in double quotation marks (") that expresses a percentage value ("0%"..."100%"). The default value is "50%".
"drawHatAsBox": boolean
Defines the style of the box plot hats. Valid values are:
- true, which draws box plot hats as boxes.
- false, which draws normal hats. This is the default value.
"notch"
Defines the properties of an optional indentation of the box at the median line.
"width": "string"
Is a percent string (less than "100%") that defines the notch inset as a percent of the width of the box. The default value is undefined, which does not draw a notch.
"multiplier": number
Is a factor used in determining how far the notch extends between the median point and the first and third quartile points. The default value is 1.58. The formula used to calculate the range is:
+/- notch.multiplier * (box upper value - box lower value) / sqrt(data point count)
"medianLine"
Defines the properties of the line that represents the median point of the box plot.
"width": number
Is the width of the median line, in pixels. The default value is 1.
"color": "string"
Is a color specification string that defines the color of the median line. The default value is "black".
"dash": "string"
Is a string that defines the dash properties of the median line. Enter the pixel size of a dash followed by the number of pixels between the dashes. The default value is "", which draws a solid line.
"connectorLine"
Defines the properties of the connector lines and hats, when "drawHatAsBox" is false.
"width": number
Is the width of the connector lines, in pixels. The default value is 1.
"color": "string"
Is a color specification string that defines the color of the connector lines. The default value is "black".
"dash": "string"
Is a string that defines the dash properties of the connector lines. Enter the pixel size of a dash followed by the number of pixels between the dashes. The default value is "", which draws a solid line.
"meanMarker"
Defines the properties of a marker drawn at the mean point in the box plot.
"visible": boolean
Defines whether to draw a mean marker. Valid values are:
- true, which draws a mean marker.
- false, which does not draw a mean marker. This is the default value.
"color": "string"
Is a color specification string that defines the color of the mean marker. The default value is undefined.
"border"
Defines the properties of the mean marker border.
"width": number
Is the width of the border, in pixels. The default value is 1.
"color": "string"
Is a color specification string that defines the color of the connector lines. The default value is undefined.
"dash": "string"
Is a string that defines the dash properties of the marker border. Enter the pixel size of a dash followed by the number of pixels between the dashes. The default value is undefined.
"size": number
Is the size of the mean marker, in pixels. The default value is 8.
"shape": "string"
Defnes the shape of the mean marker. All standard marker shapes are supported. The default value is "circle".
"rotation": number
Is a number that defines the number of degrees to rotate the mean marker. The default value is 0.
"tooltip": "string"
Defines a tooltip for the mean marker. The default value is undefined.
Configuring Statistical Box Plot Properties
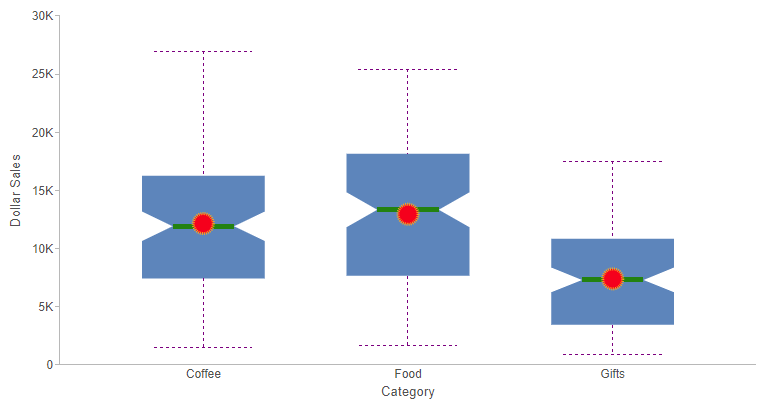
The following request generates a statistical box plot chart in which the hat width is 80% of the width of the boxes, the notch is a 50% indentation at the median line, the median line is a green 5-pixel wide line, the connector lines are purple dashed lines, and the mean marker is a red circle with an orange dashed border.
GRAPH FILE GGSALES
PRINT DOLLARS
BY CATEGORY
IF ST EQ 'NY'
ON GRAPH SET VZERO OFF
ON GRAPH PCHOLD FORMAT JSCHART
ON GRAPH SET LOOKGRAPH STAT-BOXPLOT
ON GRAPH SET STYLE *
INCLUDE=IBFS:/FILE/IBI_HTML_DIR/ibi_themes/Warm.sty,$
type=data, column=n1, bucket=x-axis, $
type=data, column=n2, bucket=y-axis, $
*GRAPH_JS
"boxPlotProperties": {
      "hatWidth": "80%",
      "drawHatAsBox": false,
      "notch": {
         "width": "50%",
         multiplier: 1.58
      },
      "medianLine": {
         "width": 5,
         "color": "green",
         "dash": ""
      },
      "connectorLine": {
         "width": 1,
         "color": "purple",
         "dash": "3 3"
      },
      "meanMarker": {
         "visible": true,
         "color": "red",
         "border": {
            "width": 3,
            "color": "orange",
            "dash": "1 1"
         },
         "size": 20,
         "shape": "circle",
         "rotation": 0,
         "tooltip": undefined
      }
   }
*END
ENDSTYLE
 END
The output is shown in the following image.

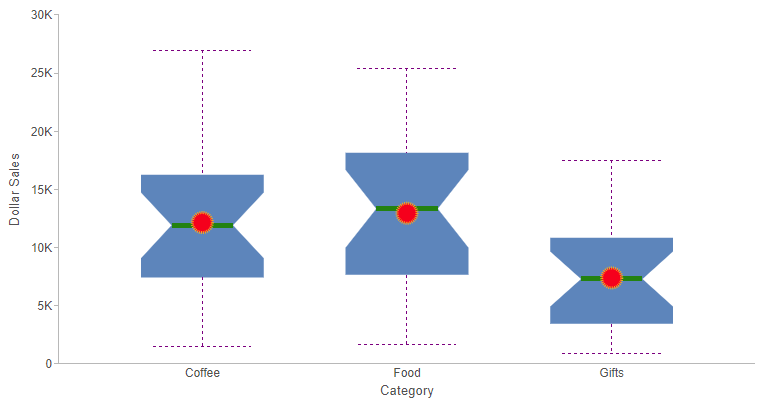
Increasing the multiplier for the notch to 3.5 extends the notch, as shown in the following image.

- Release: 8206
- Category: Creating Content, Visualization and Analytics
- Product: WebFOCUS Application and Enterprise Editions
- Tags: Release Features
