Joining Data
You can Join data sources from the data tab in WebFOCUS Designer, and then use your joined data to create new content from within the Visualization tab.
The joined data structure is not applied permanently to the metadata. This allows you to virtually join multiple data sources as if they were a single data source, from which you can report in a single request. This can increase the number of relevant fields available for use in your content, giving you an expanded selection of data specific to your charting purposes.
The Join is created when fields that match in your original data source and second data source are identified. For example, you can Join two data sources on a Join field of ID Product, using just one data source in your chart. You can then create content using your Joined data source.
The following image shows an example of joined data in WebFOCUS Designer.
Procedure: How to Create a Basic Join
You can Join data sources based on shared fields to enhance the data available to you, and then create charts based on the joined data source.
-
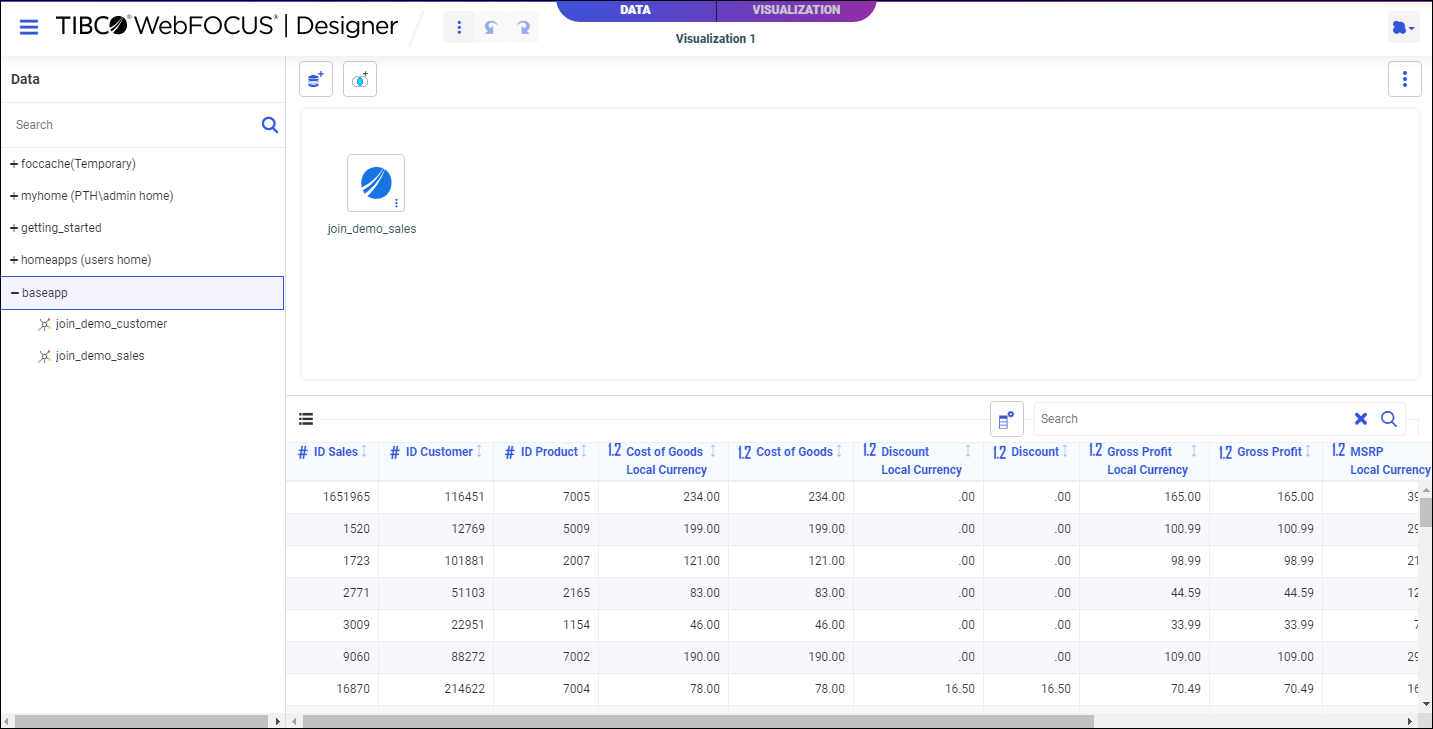
From the WebFOCUS Designer Visualization tab, click the Data tab.
Your data source displays as a synonym on the Data tab canvas, and sample data displays in a tabular format similar to a spreadsheet, as shown in the following image.
-
From the Data panel, drag a synonym to the canvas and drop it on your original data source to create a Join, as shown in the following image.
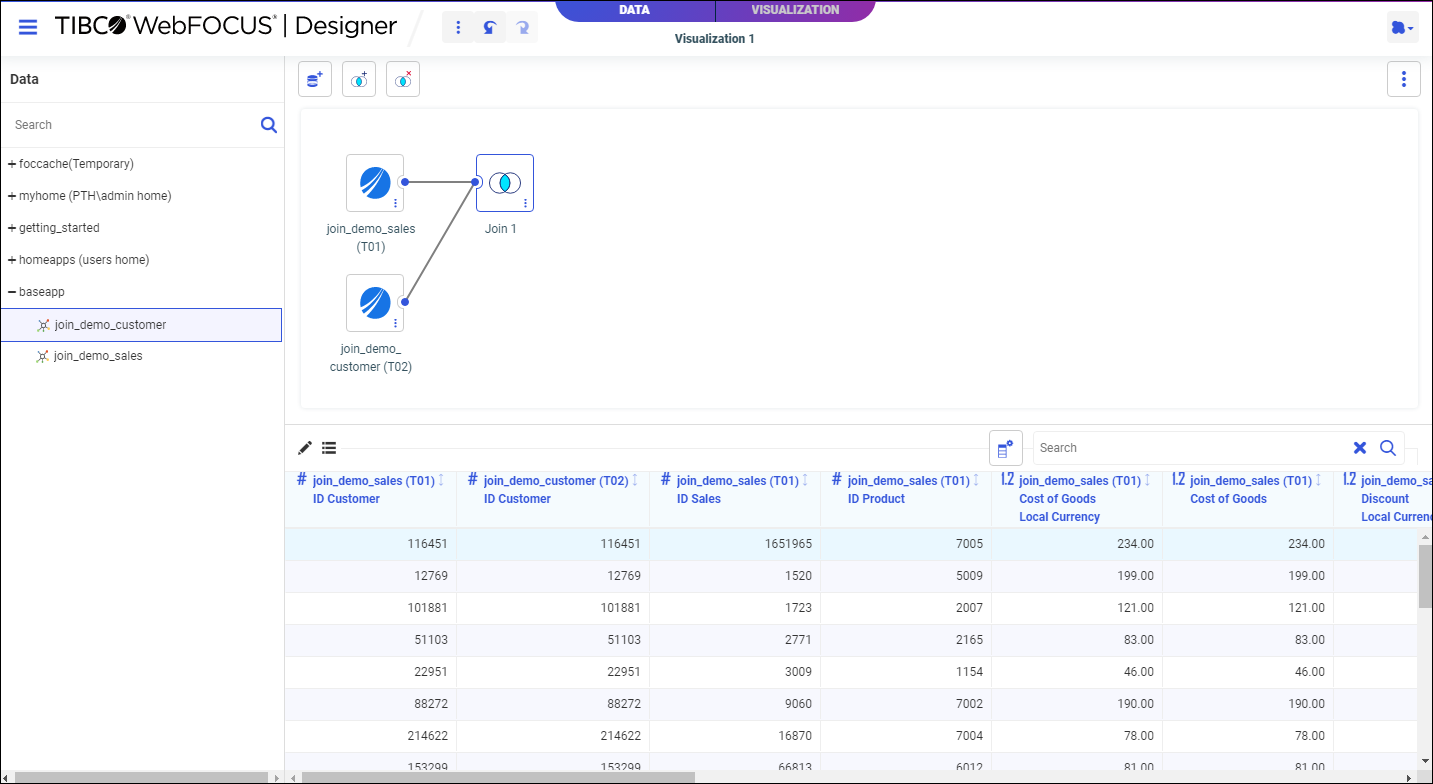
A Join object is added between the two synonyms on the canvas as shown in the following image.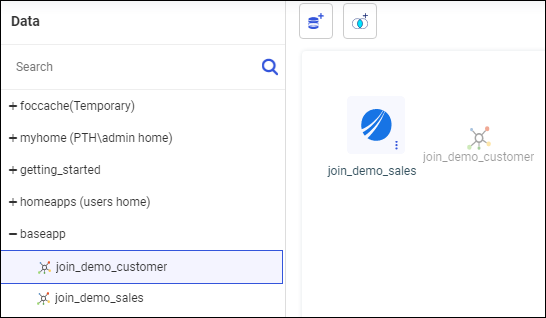
The canvas provides the following toolbar options:- Get Data. Opens the Get Data dialog box, where you can select additional data sources to be joined with your original data source.
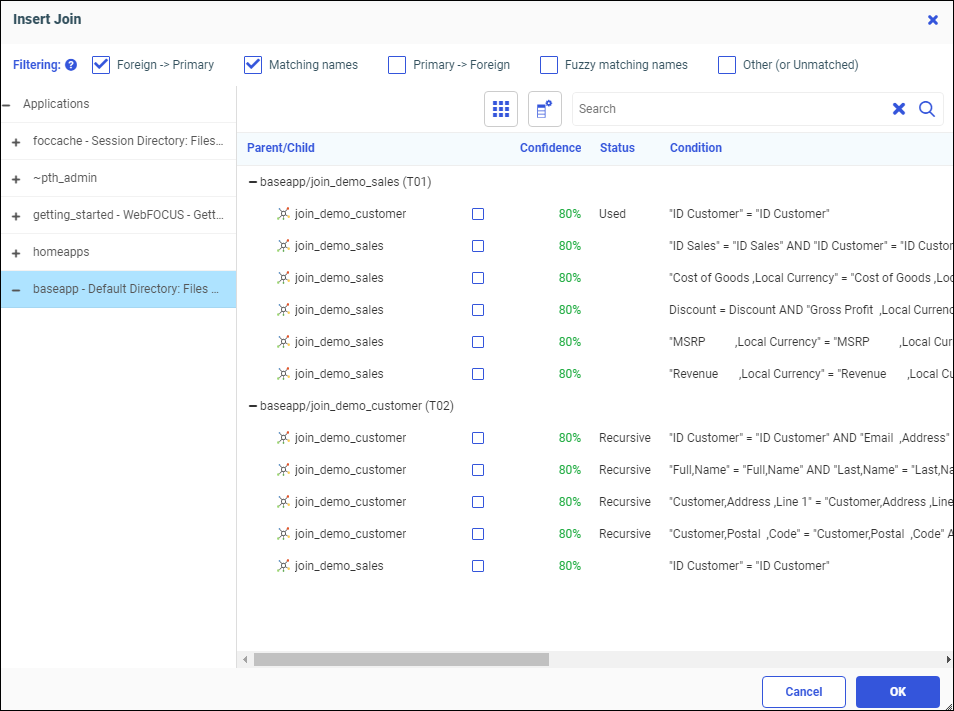
- Insert Join. Displays potential Join candidates from a relational database, including confidence scores, as shown in the following image.
- Clear Join. Removes the Join from the data flow. You can also right-click the Join object or a synonym joined to the original data source, and click Delete to remove the Join.
Note: Before removing a recursive Join (when a table is joined to itself) you must remove any fields with active content from the first instance of the table.
The canvas provides the following menu options:
- Flow view. An icon represents each synonym, and an icon that displays the type of join represents each join.
- Model view. A list box represents each synonym, and a vector between the joined synonyms represents each join.
- Arrangement. Select a Layout option to define the spacing between objects on the canvas, or click Auto Arrange to reset the display of objects in the canvas to the default arrangement:
- Vertically spread out.
- Vertically compressed.
- Vertically compressed with long H-space.
- Default.
- Auto Arrange.
- More options. Sets the following Join defaults:
- Insert child segment with snowflakes. No is the default, which inserts only the segment selected. You can select Yes to insert the selected segment and all of its descendants.
- Display full component names. Yes is the default. Full component names are field names qualified/prefixed with the synonym and segment name.
- Use Monotree. Yes is the default. The monotree view displays the current folder in the Data panel and provides navigation to other folders. Select No to display all folders in a traditional tree view.
- Show undo/redo button with history. No is the default. Select Yes to display the history button.
Click the pencil icon to display a Join configurator and data profiler, as shown in the following image.
Using the Join configurator, you can change the join type or change expressions and operators. Check the Multiple check box to indicate a one-to-many Join. The following Join types are available: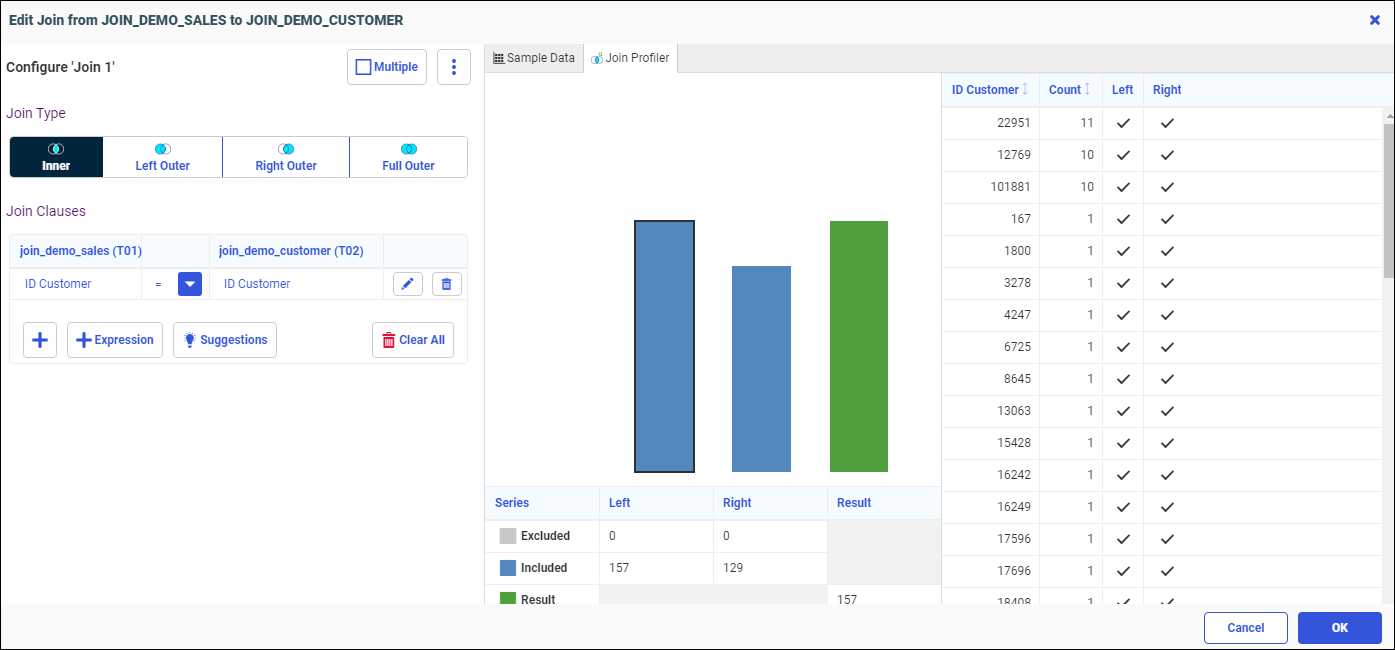
- Inner. Returns only records where the selected join fields match between the left-side table and the right-side table. If there are no matches, no records are returned.
- Left Outer. Returns all records from the left-side table, and only matched records from the right-side table.
- Right Outer. Returns all records from the right-side table, and only matched records from the left-side table.
- Full Outer. Returns all records, matched and unmatched, from the left-side table and the right-side table. This type of Join can potentially return very large result-sets and can take longer to run.
Click Suggestions to display Join Suggestions, including a confidence score based on any database relationships and the number of matching names in the fields, as shown in the following image.
Click the plus sign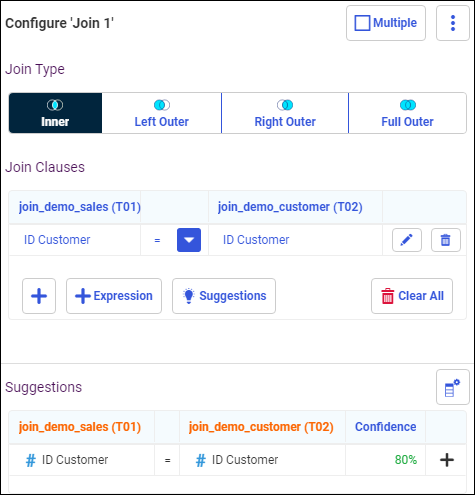
 to add the suggestion to the join pair list.
- In the Join Profiler tab, a join analyzer chart displays the number of matching values from each part of the join and the total number of values included in the data source as a result of the join, and a key fields grid showing LHS and RHS match states, as shown in the following image
You can click the table bars or numbers to display the matching fields in the report, and then click the Clear selections icon to clear the matches and return the report to show all values.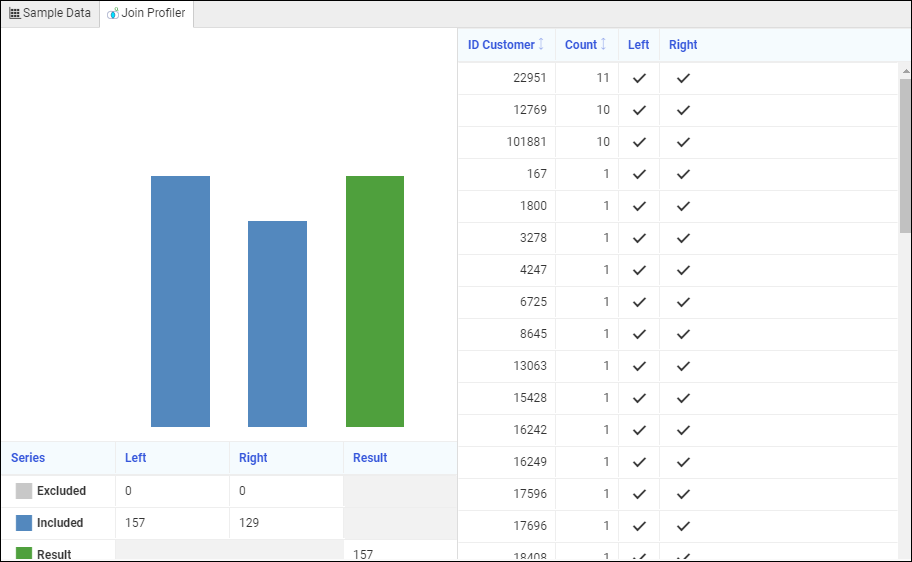
In the Sample Data tab, the values for the field being joined in each synonym are displayed, as shown in the following image.
To create content from your Join, click the Visualization tab and then click Save to save your content.
- Release: 8207
- Category: Accessing Data
- Product: WebFOCUS Home Page