Joining Data in WebFOCUS Designer
In WebFOCUS Designer, you can Join data when creating a Chart or Workbook, and create new content from your joined data.
The joined data structure is used when WebFOCUS runs the Chart or Workbook, and is not applied permanently to the metadata. This allows you to virtually join multiple data sources as if they were a single data source, from which you can report in a single request. This can increase the number of relevant fields available for use in your content, giving you an expanded selection of data specific to your charting purposes.
The join is created when fields that match in your original data source and second data source are identified. For example, you can join two data sources on a join field of ID Product, using just one data source in your chart. You can then create content using your joined data source.
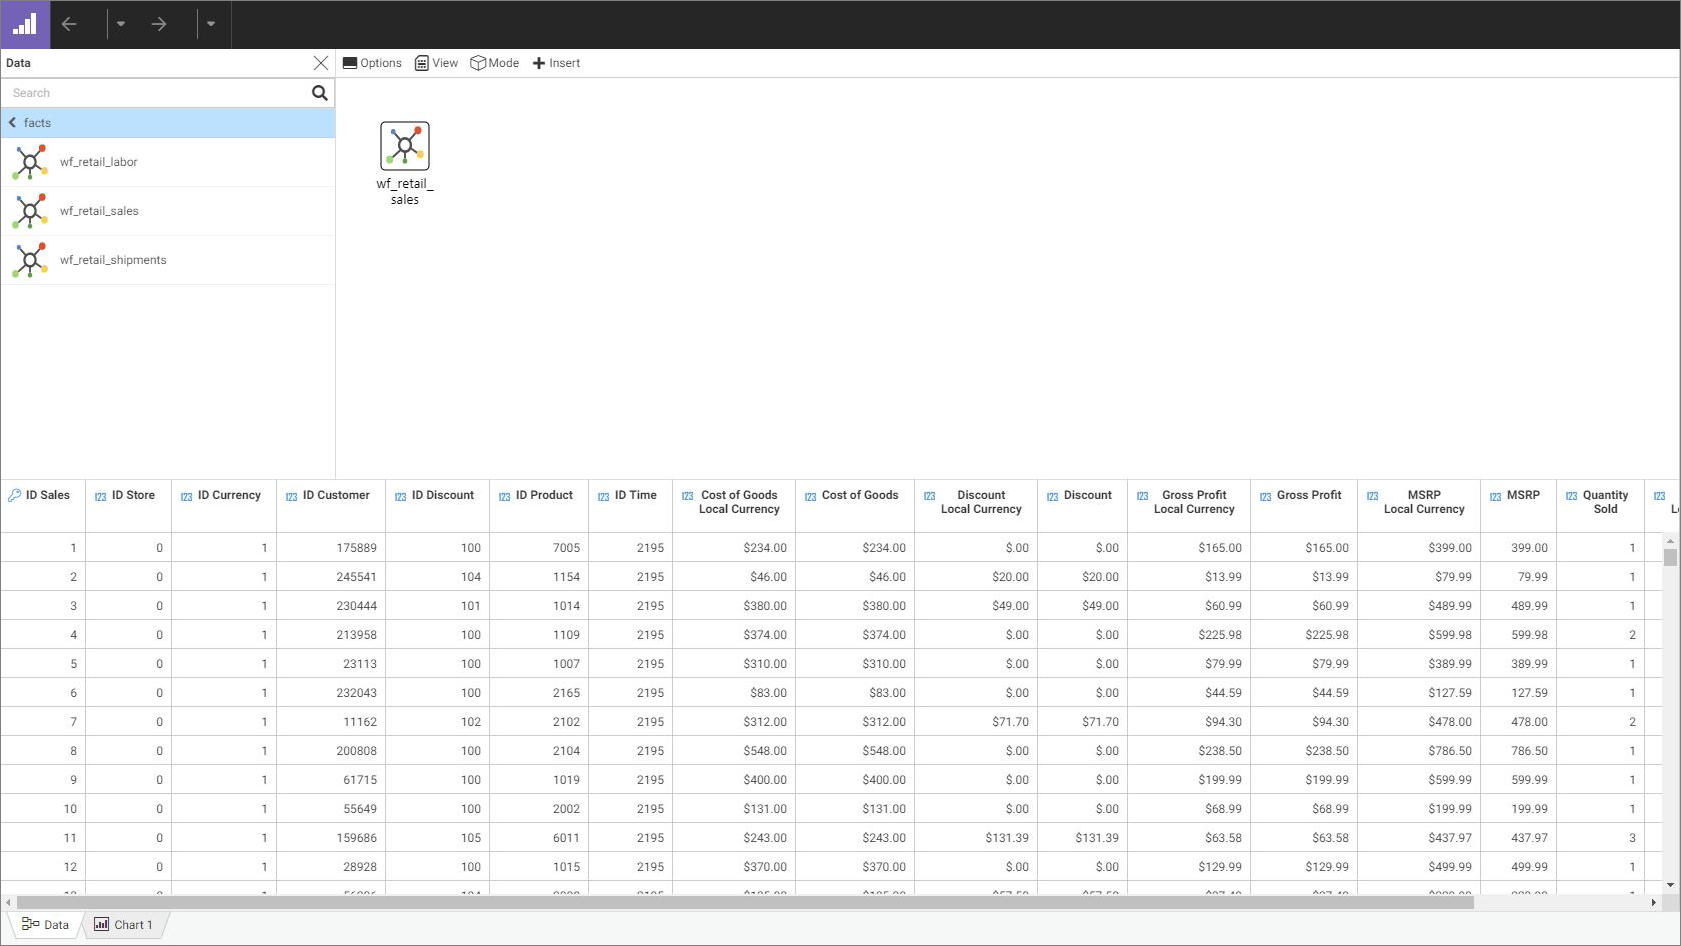
The following image shows the Data tab within WebFOCUS Designer displaying an original data source.
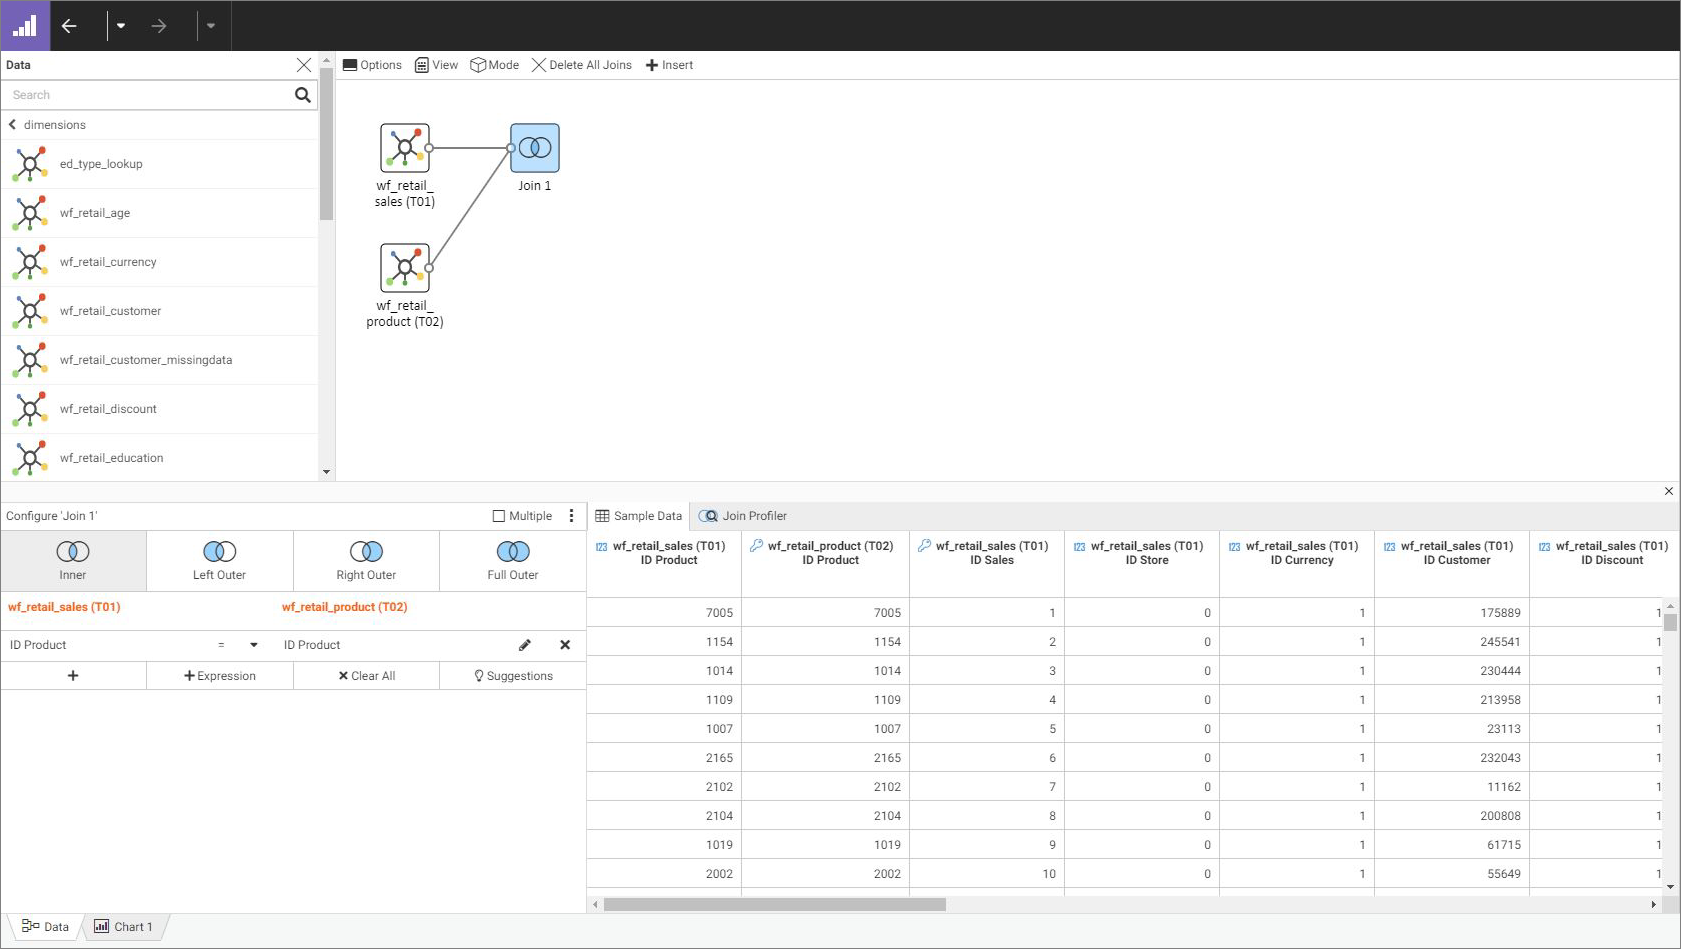
The following image shows the Data tab within WebFOCUS Designer displaying joined data sources.
Resources Tree
Use the Resources tree to select synonyms from your application path that you want to add. Click an application folder to display the available synonyms in that folder. You can return to the previous folder by clicking the folder name at the top of the tree.
Canvas
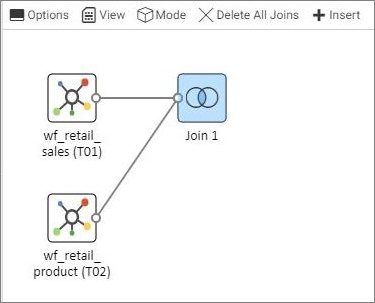
You can drag a synonym from the resources tree onto the canvas, on top of your original data source, to join them together. A join object is added between the two synonyms on the canvas, as shown in the following image.
You can also drag additional synonyms into the canvas. Right-click the join object or a synonym joined to the original data source, and click Delete to remove the join from the data flow.
You can make the following edits from the canvas toolbar:
Options
Sets the following join defaults:
- Insert child segment with snowflakes. The default is No, which inserts only the segment selected. You can select Yes to insert the selected segment and all of its descendants.
- Display full component names. The default is Yes. Full component names are field names qualified/prefixed with the Master File and segment name.
- Use Monotree. The default is Yes. The monotree view displays the current folder in the Data panel and provides navigation to other folders. Select No to display all folders.
View
The view options for Model mode are:
- Collapse All. Collapses all the synonyms so the fields do not show.
- Expand All. Expands all the synonym icons to show four fields.
- Set to Standard Size. Shows four fields at a time.
- Expand to Full Size. Expands the synonym boxes to full size.
- Expand to Custom Size. Options are: Height standard, Height Full, Width Standard, Width Full.
- Auto Arrange. Automatically arranges the synonyms.
The view options for Flow mode are:
- Layout. Options are: Vertically spread out, Vertically Compressed, Vertically Compressed with long H-Space, and Default.
- Auto Arrange. Automatically arranges the synonyms and joins.
Mode
Displays the joins in the following modes:
- Model. Each synonym is represented by a list box, and each join is represented by a vector between the joined synonyms.
- Flow. Each synonym is represented by an icon, and each join is represented by a container that displays the type of join.
Delete All Joins
Deletes all joined segments.
Insert
You can insert a child or root in Model mode. You can add a join in Flow mode.
Data Sheet
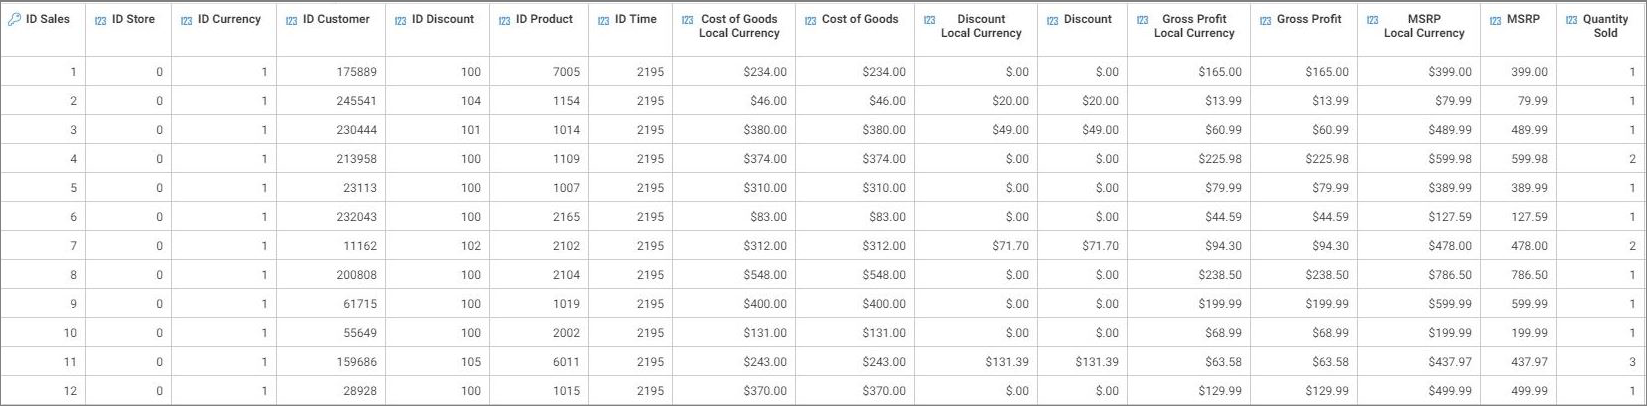
The current state of your data is reflected in the Data sheet, which shows a data sample in a tabular format similar to a spreadsheet, as shown in the following image.
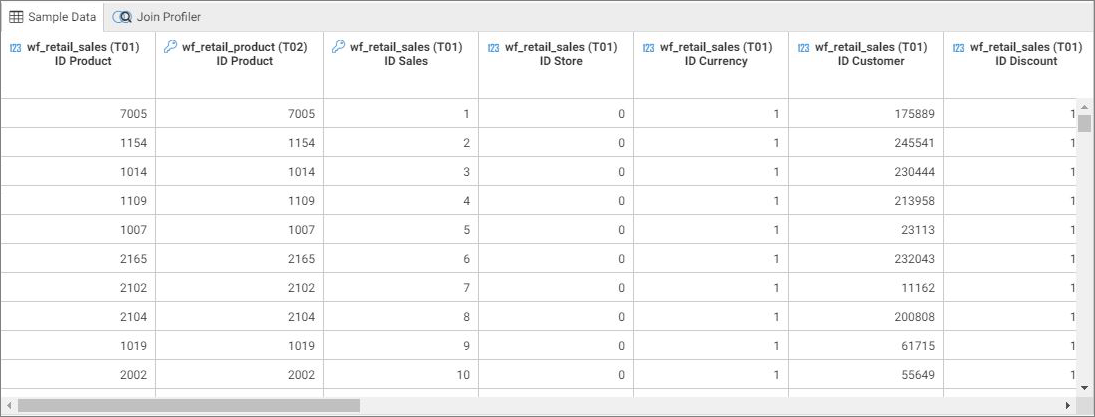
Sample Data
If you click the Sample Data tab, which is the default setting, the values for the field being joined in each synonym are displayed, as shown in the following image.
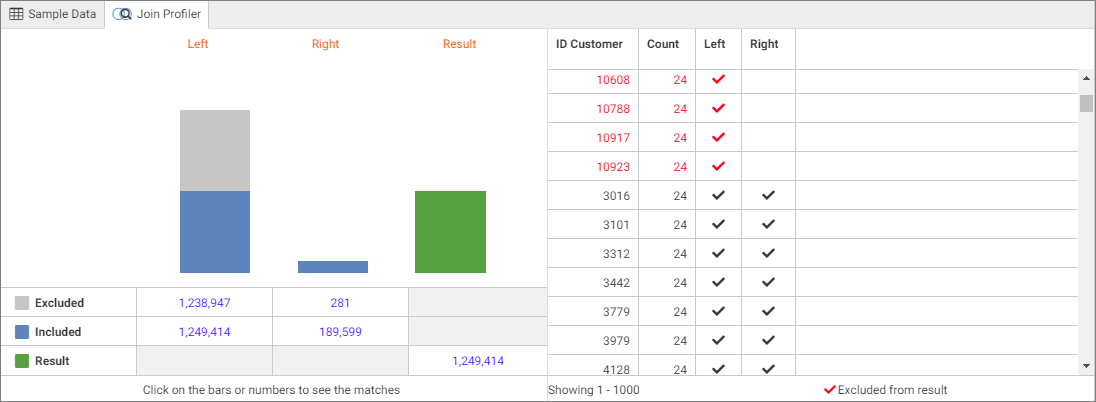
Join Profiler
If you click the Join Profiler tab, a join analyzer chart displays the number of matching values from each part of the join and the total number of values included in the data source as a result of the join, and a key fields grid showing LHS and RHS match states, as shown in the following image.
You can click the table bars or numbers to display the matching fields in the report. Clicking the filter icon ![]() clears the matches and returns the report to show all values, as shown in the following image.
clears the matches and returns the report to show all values, as shown in the following image.
![]()
Join Configurator
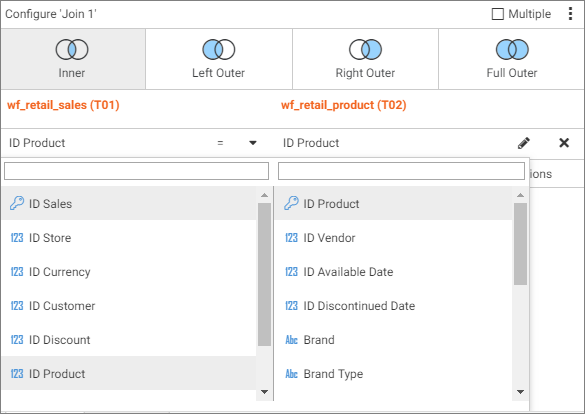
You can modify the join using the Join configurator, as shown in the following image.
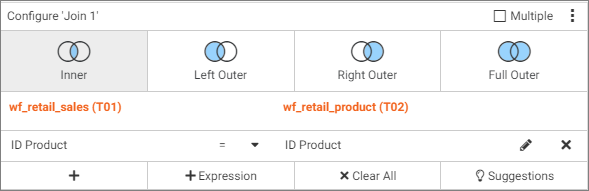
You can change the join type, change expressions and operators, and check the Multiple check box to indicate a one-to-many join. The following join types are available:
- Inner. Returns only records where the selected join fields match between the left-side table and the right-side table. If there are no matches, no records are returned.
- Left Outer. Returns all records from the left-side table, and only matched records from the right-side table.
- Right Outer. Returns all records from the right-side table, and only matched records from the left-side table.
- Full Outer. Returns all records, matched and unmatched, from the left-side table and the right-side table. This type of join can potentially return very large result-sets and can take longer to run.
You can display the joined fields using the double drop-down menu, as shown in the following image.
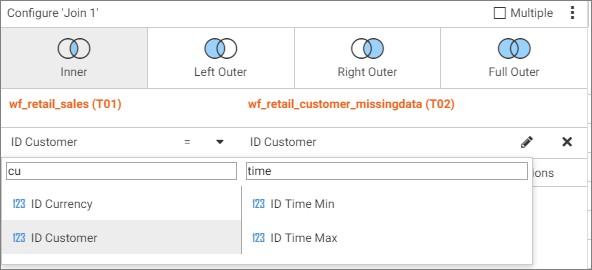
Type inside the search bars to restrict the field results displayed in the drop-down menus, as shown in the following image.
Click Suggestions to display Join Suggestions, including a confidence score based on any database relationships and the number of matching names in the fields, as shown in the following image.
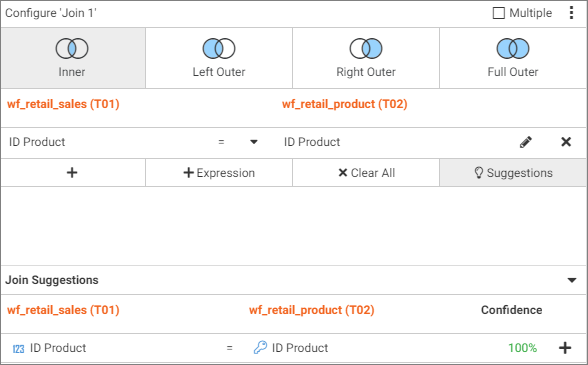
Click the plus icon ![]() to add the suggestion to the join pair list.
to add the suggestion to the join pair list.
In WebFOCUS Designer, you can create a single cluster synonym with a maximum of 1022 joins.
Procedure: How to Create a Basic Join
You can join data sources based on shared fields to enhance the data available to you, and then create charts based on the joined data source.
- From the WebFOCUS Home Page, on the Action Bar, click the Designer tab or Common tab, then click Chart or Workbook.
Note: The Report button appears in the Designer tab if you have enabled the Technical Preview feature.
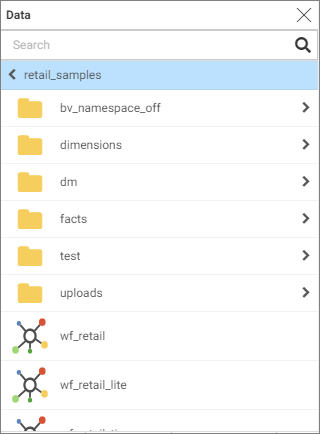
- From the Open dialog box, select a data source, as shown in the following image.
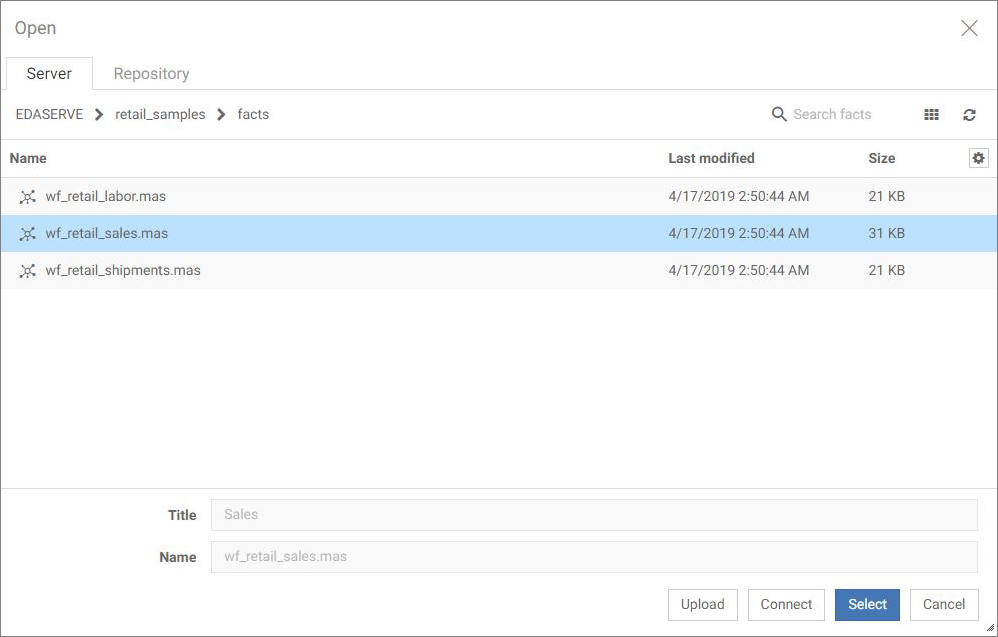
The selected file opens in WebFOCUS Designer.
- Click the Data tab at the bottom-left of the canvas.
The selected data source displays on the canvas and in the tabular Data Sheet, as shown in the following image.
Note: You can have multiple Data tabs open in a single browser.
- From the Data panel, navigate to the folder containing the synonym you want to add.
- Drag the synonym to the canvas and drop it on your original data source to join them, as shown in the following image.
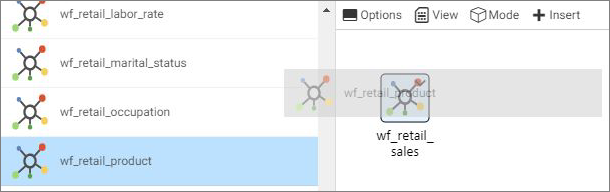
A join object is added between the two synonyms on the canvas, and panels display for configuring and profiling data, as shown in the following image.
- Click the chart tab at the bottom-right of the canvas.
- On the toolbar, click Save.
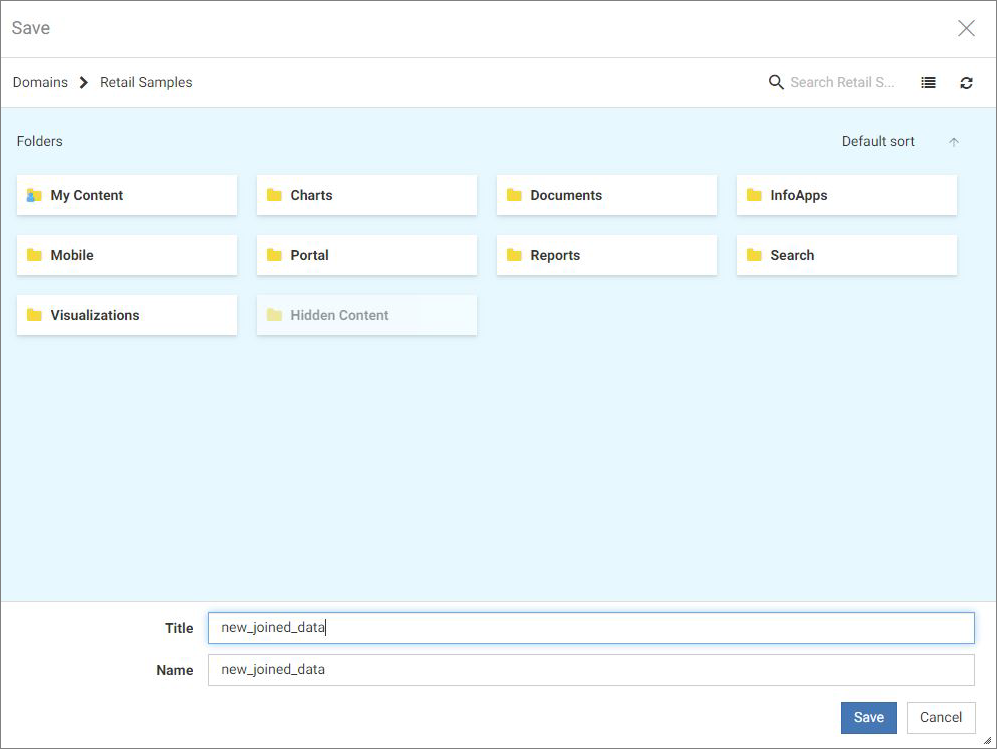
The Save dialog box opens.
- Name your new joined file and click Save, as shown in the following image.
Your new joined data is saved. From the chart tab, you can create content from your new joined data.
When you create your content, you see a sample of your data by default. This helps improve performance when using large data sets. Using a lower record limit can improve performance, but due to the smaller data sample size, the design time preview of your content may not reflect the actual distribution of your full data set as it appears when you run your content. To change the design time record limit when creating content, click Settings on the WebFOCUS Designer toolbar.
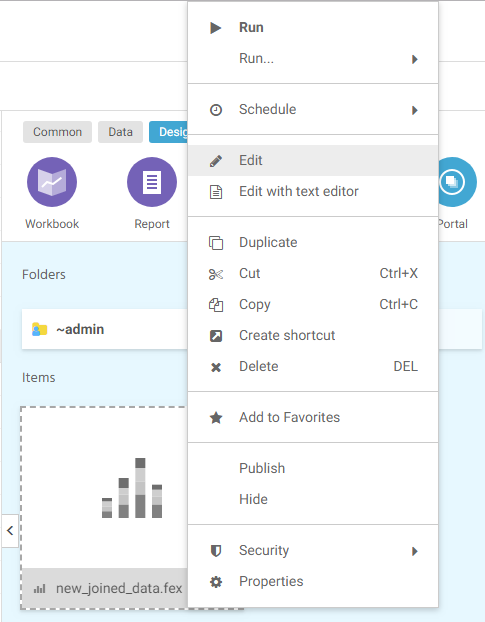
Note: You can edit your joined data and perform other property-related tasks using the shortcut menu from the WebFOCUS Home Page, as shown in the following image.
- Release: 8206
- Category: Connecting to Data
- Product: WebFOCUS Home Page