Running an In-Document Analytics Dashboard on a Mobile Device
You can use the Adaptive Dashboard feature to provide a fixed view of your interactive dashboards, which improves navigation on mobile devices. Adaptive Dashboard is only available when you select the Legacy style of In-Document Analytics capabilities.
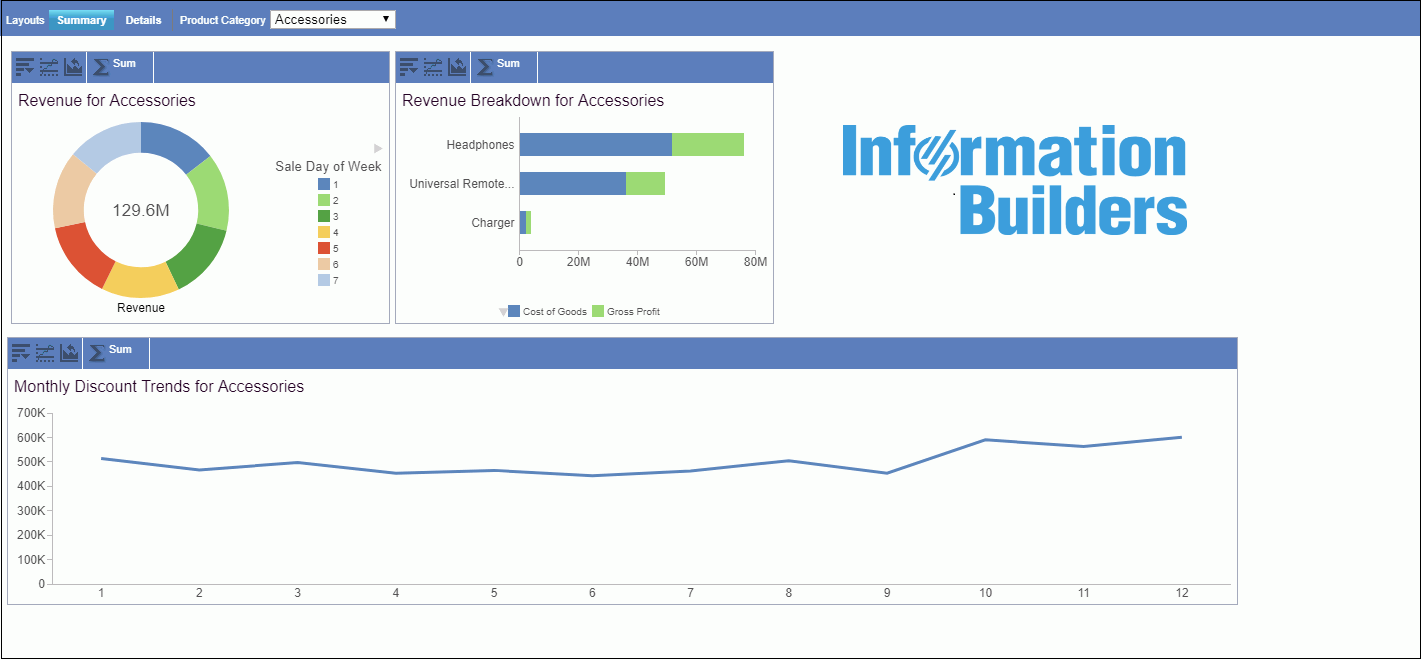
The following image is an example of an Adaptive Dashboard in a desktop environment.
The following image is an example of an Adaptive Dashboard on a mobile device.
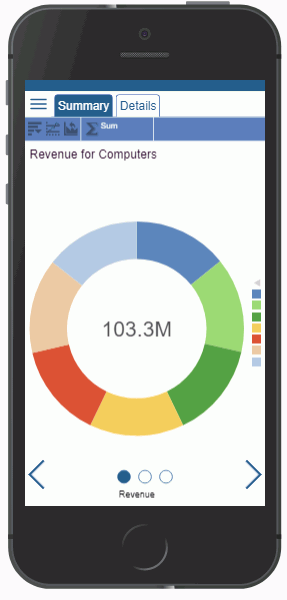
There are a number of navigational options that you can use to make it easy to get around when working with your results. These include the dashboard bar at the top of the screen that contains the page layout tabs, circles at the bottom of the screen that indicate the number of report or chart components available on the selected tab, navigation arrows at the bottom of the screen that allow you to move between components with ease, and a hamburger menu that displays available filter controls.
You can enable the Adaptive Dashboard option on new or existing documents that use the Legacy style, in InfoAssist, by clicking the Adaptive Dashboard button on the Layout tab, in the Page Setup group on the ribbon.
The following image shows a sample interactive dashboard that is running on an iPad, without Adaptive Dashboard enabled.
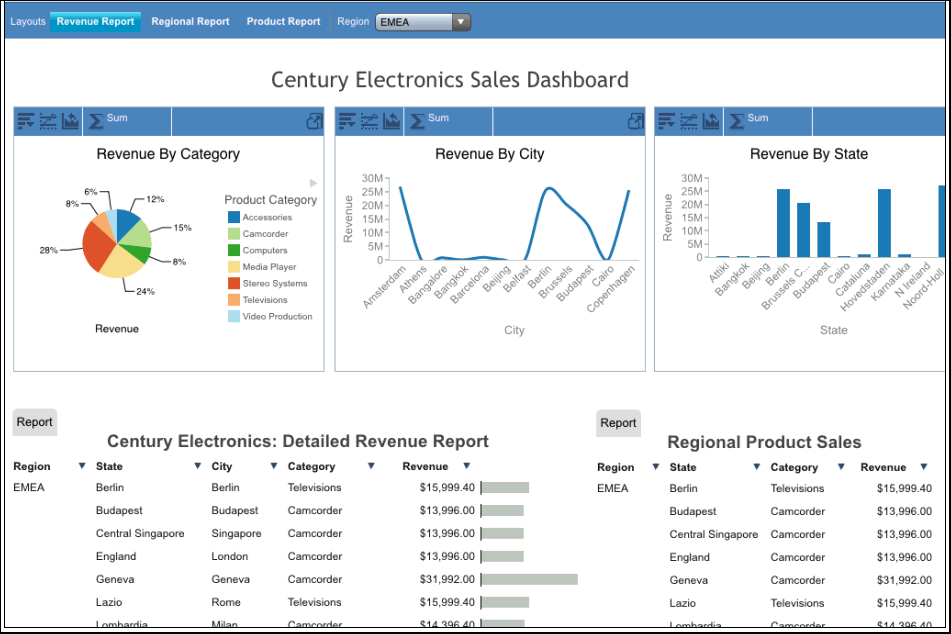
The dashboard bar at the top of an interactive dashboard contains the page layout tabs. On mobile devices, the bar is floating instead of fixed, making the available functions always accessible, no matter where you move within the dashboard.
You can use standard gestures on an interactive dashboard to scroll left and right or up and down, or zoom in and zoom out.
You can tap the Fullscreen View icon ![]() on the right edge of the pagination bar for an individual grid or on the right edge of a chart tool bar or pivot tool bar to view the grid, chart, rollup table, or pivot table on the dashboard in full-screen mode.
on the right edge of the pagination bar for an individual grid or on the right edge of a chart tool bar or pivot tool bar to view the grid, chart, rollup table, or pivot table on the dashboard in full-screen mode.
When using Adaptive Dashboard inside an iframe on a mobile device (for example, when running it from the Home Page without using the New Window option), the output is displayed with the components layout and menu options displayed when run from a desktop. If you choose to display the output in a new window, then it will display using the Adaptive Dashboard view for mobile devices.
Some of the areas impacted by this issue are:
-
The WebFOCUS Home Page interactive window
-
The WebFOCUS Designer
-
The Collaborative Portal
-
The Basic BI Portal
-
The InfoMini application
-
The AutoPrompt page
- Release: 8207
- Category: Visualizing Data
- Product: In-Document Analytics