Setting Conditional Styling Based on Data Values
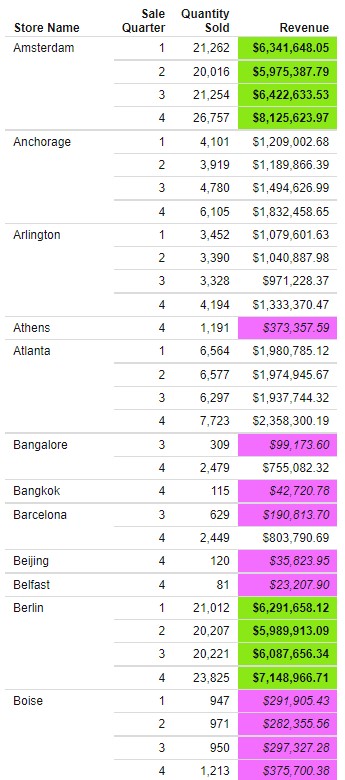
Conditional styling is a feature that applies unique styling to cells in a chart or report when their values meet specified criteria. This allows you to highlight values that are especially high or low, or are higher and lower than those in another field, making it easy to spot important information in your content. You can even use conditional styling to add drill down links to values that match your set criteria, allowing users who run the chart or report to access additional context and information pertaining to those records. The following image shows a report to which conditional styling has been applied. Revenue values higher than 5,000,000 have a bright green background, while revenue values lower than 500,000 have a bright pink background.
Conditional styling is set on the field level. To enable conditional styling for a field, right-click the field that you want to style in its bucket, and then click Conditional Styling. The Conditional Styling panel opens, where you can set the criteria that, when met, will trigger conditional styling. By default, the field to which the conditional styling will be applied is the field whose values the conditional styling criteria are evaluated against. You can change the field used in the criteria, however, allowing you, for example, to style values in a sort field based on the measure values associated with them.
You can set the operator and the field or static value to which the values of the selected field will be compared. For example, you can choose to apply conditional styling to values in a field that exceed a specified value, or that are greater than the value in the same row of another specified field. For example, you may wish to highlight sales where the cost of goods was greater than the revenue, indicating a net loss. If you choose to compare field values to another field, you can select one from a list of measure or dimension fields in the chart or report. The list of fields is filtered based on the type of field to which the comparison is being made. To compare field values to a static value, type that value into the text box.
You can create a conditional styling criterion using the following comparative operators:
- Equal to
- Not equal to
- Greater than
- Less than
- Greater than or equal to
- Less than or equal to
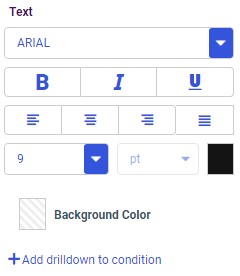
Once you have set your criteria for conditional styling, you can apply a variety of styling properties to be used when the criteria are met. For a chart, you can set the color of risers that meet the conditional styling criteria. For a report, you can set the font, text size, text color, font style, justification, and background color of conditionally styled cells. The styling options for a report are shown in the following image.
In addition to standard report cell styling options, you can also create drilldowns as part of your conditional styling, which allow users who run the report to drill from values that match the conditional styling criteria to content or external resources with additional information. Values that do not meet the criteria do not have drilldowns applied. For more information about drilldowns, see Adding Drill-Down Links to Content.
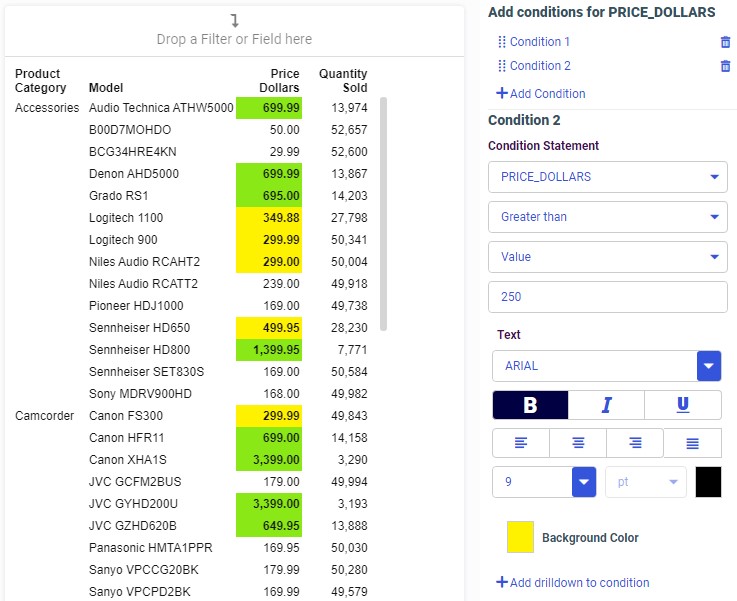
Multiple conditional styling criteria can be added to each field. They are listed as separate conditions above the conditional styling options. If multiple conditions are available, you can click the name of the condition to edit it. Click the trash can icon next to a condition name to delete it. You can also use the handles next to the name of the condition to reorder your styling conditions, allowing you to specify the order in which the conditions should be tested against each record in the selected column. This can be especially useful if you have conditions that overlap. For example, if you have a condition to set the background of cells with values greater than 250 to yellow, and a second condition to set the background of cells with values greater than 500 to bright green, then as a best practice, place the condition with the higher threshold first, so that only values above 500 are initially styled, before the remaining values are styled based on subsequent criteria, as shown in the following image.
Once you have set the conditions and the styling that you want to apply when those conditions are met, click Apply. You can then close the Conditional Styling panel. When you run the report, the values in the styled field that match your specified conditions have special styling applied, making them easy to identify at a glance.
- Release: 8207
- Category: Visualizing Data
- Product: WebFOCUS Designer
- Tags: Enhancements, Release Features