Generating Instant Insights in WebFOCUS Designer
You can easily run advanced analyses and generate visualizations and narratives on your data sets, without manually preparing and analyzing your data, or having prior knowledge of data science or statistics.
With one click, the Instant Insights capabilities in WebFOCUS Designer recognize trends in your data, generate customizable visualizations as charts with natural language headers, and categorize the charts into tabs. You can add these charts to the WebFOCUS Designer canvas and build a page, or add them to existing pages or dashboards. Then you can save and share your insights with others.
Note: To use the Instant Insights feature, binaries must be installed. For more information, see Installing and Configuring TIBCO WebFOCUS DSML Services on the TIBCO WebFOCUS KnowledgeBase.
Accessing Instant Insights
You can access the Instant Insights capabilities in the following ways:
-
In WebFOCUS Designer. From the WebFOCUS start page, click the plus menu, and then click Create Visualizations, or, from the WebFOCUS Home Page, click Visualize Data. Then select a data source from the dialog box.
-
After Uploading a Data File. From the WebFOCUS start page, click the plus menu, and then click Get Data, or, from the WebFOCUS Home Page, click Get Data. Then select a file type, select a data source from the dialog box, click Load, and then click Visualizations.
-
After Connecting to a Data Source. From the WebFOCUS start page, click the plus menu, and then click Get Data, or, from the WebFOCUS Home Page, click Get Data, click a configured adapter, click an available connection, select a data source from the dialog box, and click Add.
Note: For more information about uploading data to WebFOCUS, see Uploading Data Files. For more information about connecting to data, see Connecting to Data Sources.
Procedure: How to Generate Instant Insights
You can generate insights on any data that you have opened in WebFOCUS Designer.
-
From the WebFOCUS start page, click the plus menu, and then click Create Visualizations, or, from the WebFOCUS Home Page, click Visualize Data.
The Select Data Source dialog box opens, as shown in the following image.
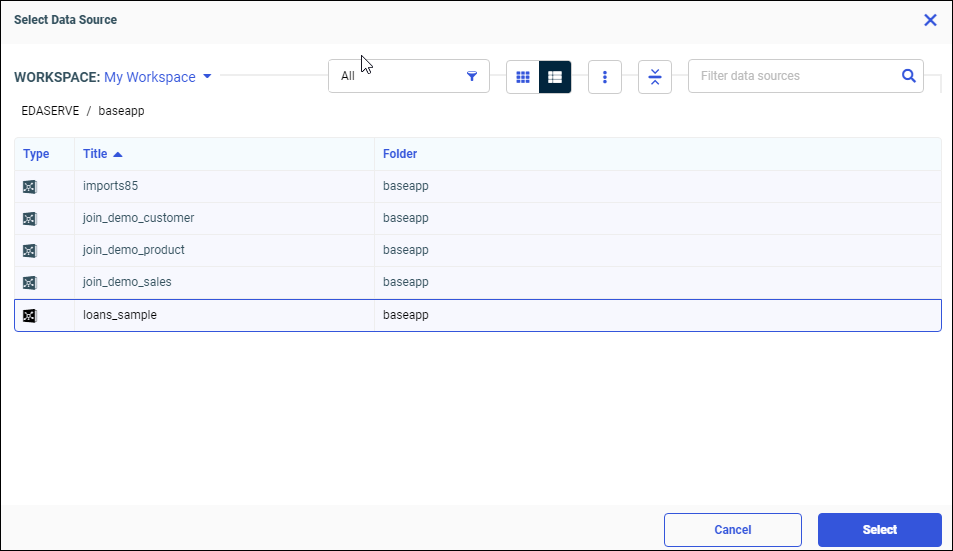
- Select a data source from which you want to generate insights.
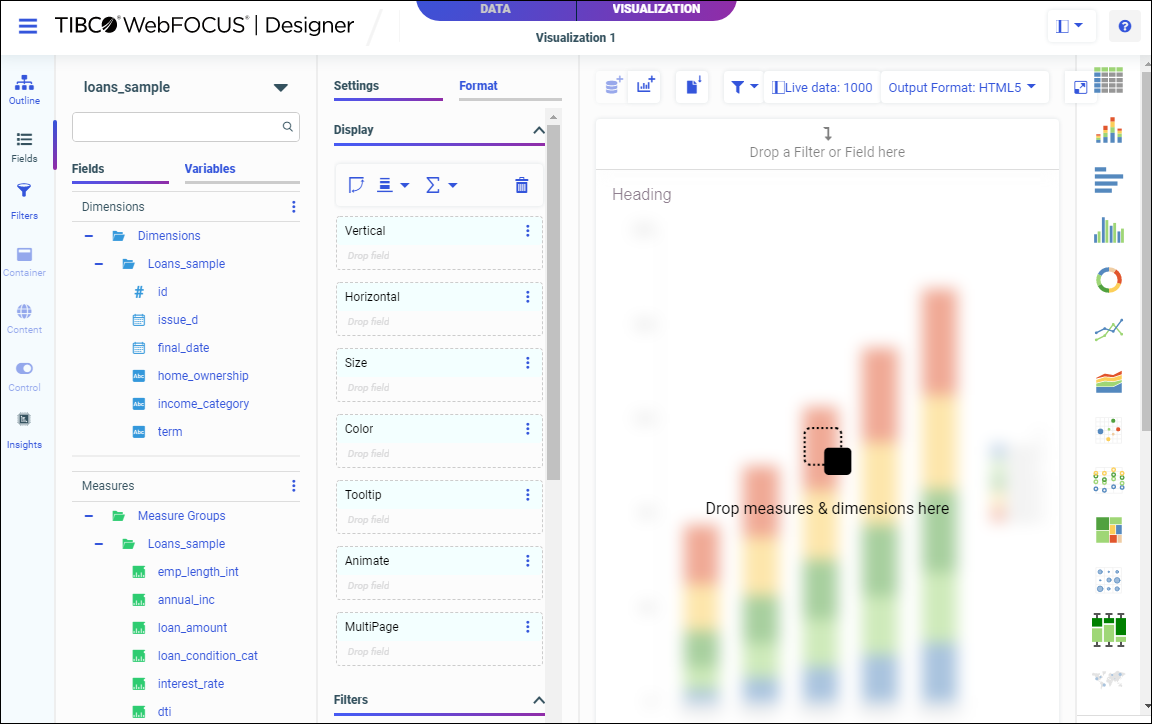
The WebFOCUS Designer Visualization tab opens, as shown in the following image.
Note: to ensure the most meaningful insights, set the canvas data limit to Sample data: All. From the canvas toolbar, click the data settings button
 , click the Sample tab, select All, and click Apply, as shown in the following image:
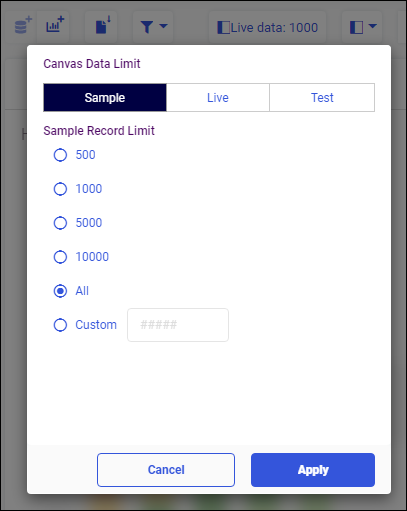
-
From the sidebar, click Insights.
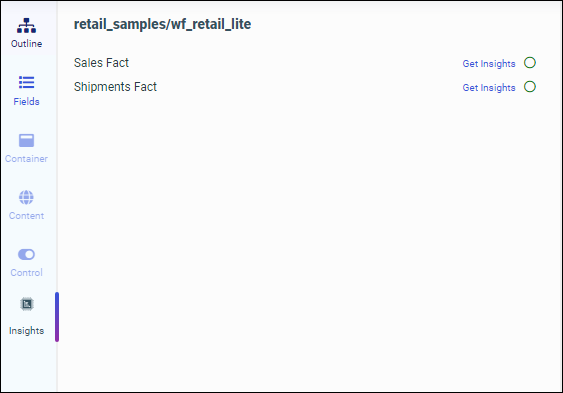
Note: If your data set contains multiple tables, you are given the option to select the table from which you want to generate insights, as shown in the following image.
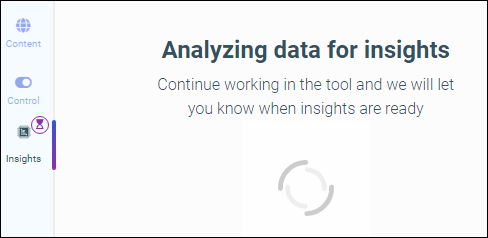
The Insights panel opens and begins analyzing your data, as shown in the following image. You can continue working in Designer while your data is being analyzed.
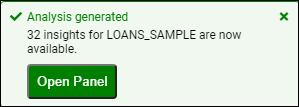
A pop-up message appears to alert you when your insights are ready, as shown in the following image.
The panel title area displays the total number of visualizations generated, and a time stamp indicates when they were generated. Visualizations are generated as charts, and are categorized into different tabs. If your data is dynamic, you can click the refresh icon to gain updated insights.
Each chart toolbar includes an automated, header narrative that explains the trends in your data. The toolbar also includes icons that allow you to copy your chart to the Designer canvas, and to expand or collapse your chart.
Depending on your data set, your charts can by categorized as follows:
-
Correlations. Detects cases where multiple measures show a similar trend or pattern. Correlations are formatted as scatter plots.
-
Outliers. Identifies unusual patterns in data.
In the following example, a scatter plot is categorized as a Correlation.
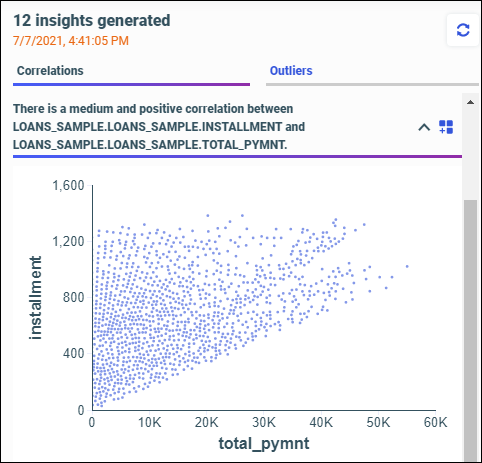
Scatter plots are generated for each pair of measures that have a high correlation score. .
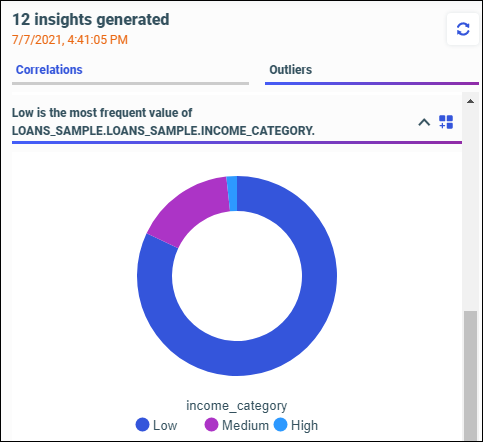
Outliers can be generated as pie charts or bar charts. In the following example, a pie chart is categorized as an Outlier.
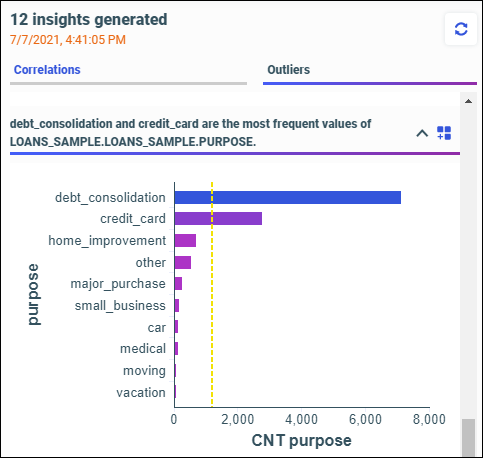
In the following example, a bar chart is categorized as an Outlier.
There are two types of detected outliers, which are based on the following functions:
-
Count function. When the count value of one or two categories is much larger than other classes for dimensions.
-
Average function. When the average value of a measure against categories in dimensions is significantly higher than in other categories.
If the count distinct of a dimension is five or less, a pie chart is generated. If the count distinct of a dimension is more than five, a bar chart is generated. Each bar chart comes with a yellow average line, so you can compare the dominant category with the average value.
-
Procedure: How to Add Instant Insights to a Page
You can add one or more charts to the page canvas.
-
Click the Copy icon
 in the chart container.
Your chart is added to the page canvas.
Note: When you copy a chart to the page canvas, if the data limit on the canvas does not match the sample data set used when generating Instant Insights, a data limit dialog box opens, as shown in the following image.
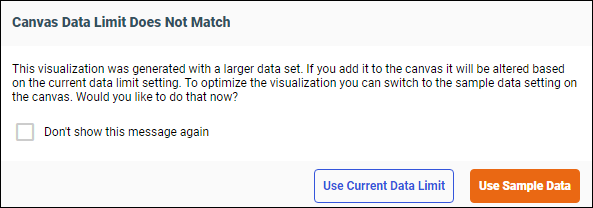
You have the option to use the current canvas data limit setting, or to update the canvas with the Instant Insights sample data setting.
-
Use Current Data Limit. Your chart is added to the page using the current canvas data limit setting.
-
Use Sample Data. Your chart is added to the page using the sample data setting. Any other charts on the page are refreshed to reflect the sample data setting.
You can select the checkbox to stop showing the data limit messaging when adding charts.
-
Procedure: How to Edit Instant Insights
You can edit the charts generated by Instant Insights to customize the content you want.
-
Select your chart on the page.
-
On the sidebar, click Fields.
The Fields tab opens, as shown in the following image.
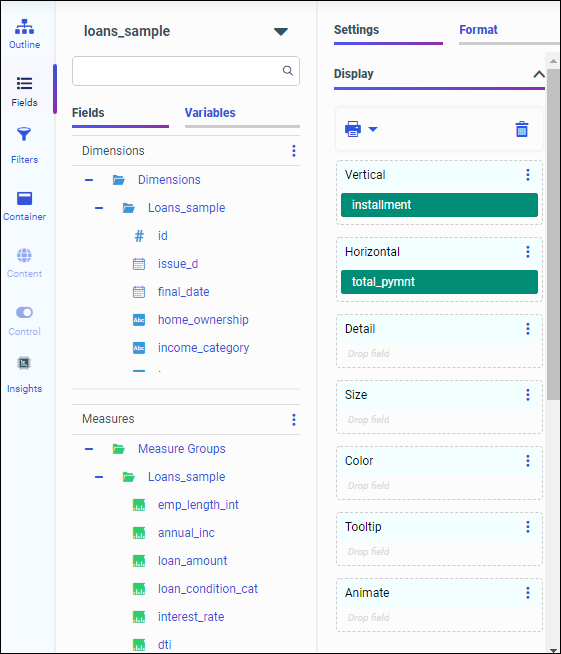
-
Drag fields into the Display panel buckets to modify your chart.
-
Right-click a field to select additional options.
Note: For more information about creating and customizing charts in WebFOCUS Designer, see Creating Charts.
Procedure: How to Save Instant Insights
Save your page so you can share your insights with others.
-
Click Save from the WebFOCUS Designer toolbar.
The Save dialog box opens.
-
Change your file location or file name as needed in the dialog box.
-
Click OK.
You can now share your data insights with others.
Note: To save as a standalone chart, select the Outline tab on the sidebar, right-click on the associated entry in the outline, and click the Save as standalone option.
- Release: 8207
- Category: Visualizing Data, Data Science
- Product: WebFOCUS Designer