Using the Data Tab
To access the Data tab, select DATA on the WebFOCUS Designer toolbar.
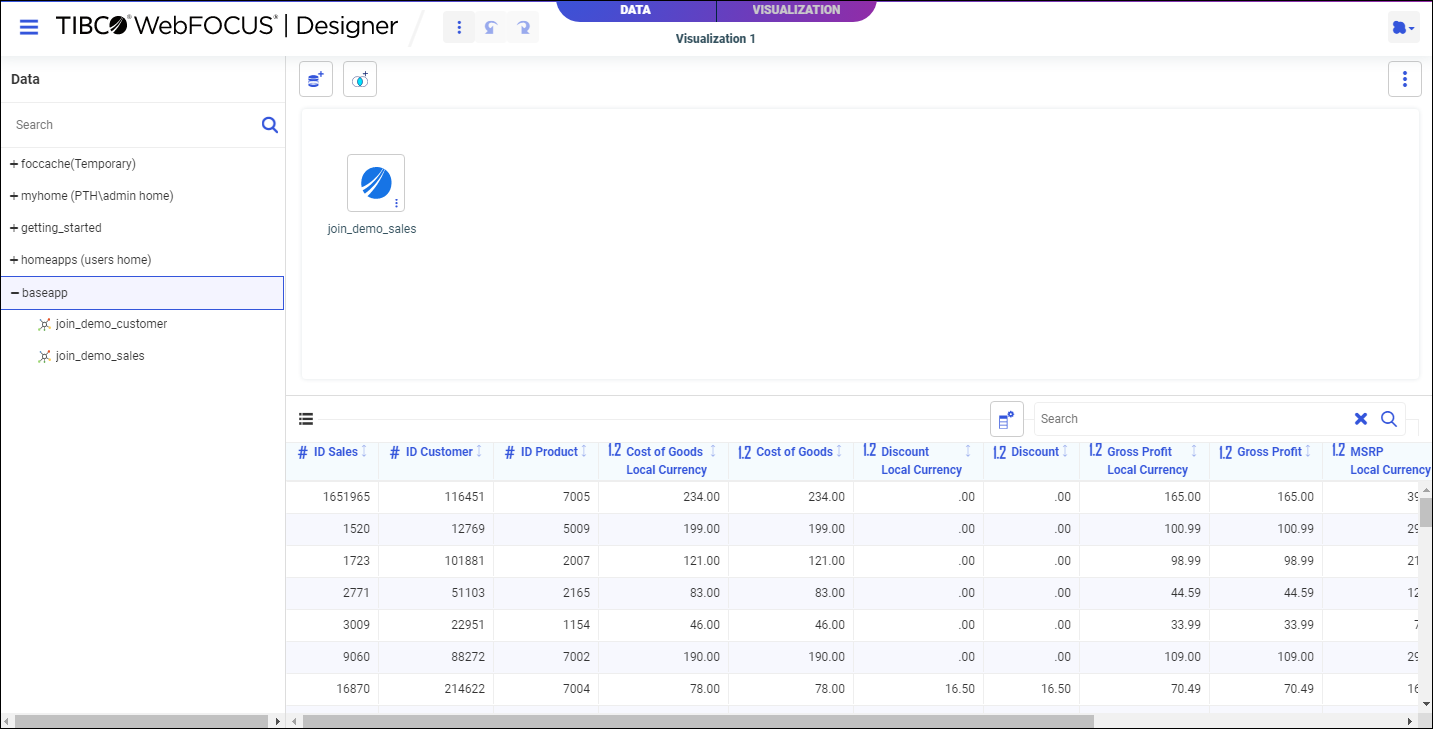
The WebFOCUS Designer Data tab with a single synonym on the canvas is shown in the following image.
The Data tab includes the following tools and components.
- WebFOCUS Designer Toolbar. Provides features that affect the entire data flow and visualization. It includes the following options:
- Application menu. Includes the following options:
- New. Creates a new visualization in WebFOCUS Designer.
- Open. Opens an existing chart, report, page, or visualization in WebFOCUS Designer.
- Save. Saves the current visualization.
- Save As. Saves the current visualization as a new file.
- Close. Closes WebFOCUS Designer.
- Advanced Options. Includes diagnostic information to help you validate and troubleshoot your data flow. The following options are available:
- View Source. Displays the source syntax of the data flow, including all synonyms and Joins.
- Session Log. Opens the Session Log dialog box, which includes a record of server configuration and activity.
- Clear Session Log. Deletes all entries from the session log.
- Diagnostics. Shows layout and override values.
- Clear Undo/Redo History. Deletes all undo and redo records.
- Undo. Undoes the previous action.
- Redo. Available when you have undone an action. Redoes the last undone action.
- View. Allows you to hide or show the Join Editor and Resources tree.
- Application menu. Includes the following options:
- Resources tree. Allows you to select synonyms from your application path that join to the data source to use for your visualization.
- Canvas. Shows the tables in your data flow. You can drag a synonym from the Resources tree onto a data source in the canvas to create a join.
- Canvas toolbar. Provides options to configure your data flow or the canvas interface. The following options are available:
- Get Data. Opens the Get Data dialog, where you can select additional data sources to be joined with your original data source.
- Insert Join. Displays potential Join candidates from a relational database, including confidence scores.
- Clear Join. Removes the Join from the data flow. You can also right-click the Join object or a synonym joined to the original data source, and click Delete to remove the Join.
Note: Before deleting a recursive Join (when a table is joined to itself) you must remove any fields with active content from the first instance of the table.
- Canvas options. Displays the following options:
- Flow view. An icon represents each synonym, and a container that displays the type of join represents each join.
- Model view. A list box represents each synonym, and a vector between the joined synonyms represents each join.
- Arrangement. Select a Layout option to define the spacing between objects on the canvas, or click Auto Arrange to reset the display of objects in the canvas to the default arrangement:
- Vertically spread out.
- Vertically compressed.
- Vertically compressed with long H-space.
- Default.
- Auto Arrange.
- More options. Sets the following Join defaults:
- Insert child segment with snowflakes. No is the default, which inserts only the segment selected. You can select Yes to insert the selected segment and all of its descendants.
- Data sheet. The current state of your data is reflected in the Data sheet, which shows a data sample in a tabular format similar to a spreadsheet. The Data sheet appears when you select a synonym on the canvas.
- Join Configurator. When a Join has been created, allows you to modify it by changing the Join type, the Join operator and expression, and the fields used in the Join.
- Sample data. When a Join has been created and you select the Sample Data tab, sample values for the joined synonyms are displayed together in a single table.
- Join Profiler. When a Join has been created and you select the Join Profiler tab, a Join analyzer chart displays the number of matching values from each part of the Join and the total number of values included in the data source as a result of the Join. To the right of this chart, a key fields grid shows LHS and RHS match states.
To create Joins in WebFOCUS Designer, drag a synonym from the Resources tree onto a synonym in the canvas to which you want to create a Join. A Join is created automatically based on common field names and values, but you can change the default Join using the Join Configurator. For more information, see Joining Data.
- Release: 8207
- Category: Visualizing Data
- Product: WebFOCUS Designer