Using In-Document Analytics on a Mobile Device
You can use In-Document Analytics technology on a mobile device, including various types of phones and tablets. This enables you to review content, offline, that is shared with you by a developer or other similar individual within your organization. You can review your data anywhere, anytime.
Mobile devices support various gestures, including swipe and drag. In-Document Analytics supports the following standard interactive gestures for multi-touch screens:
| Gesture | Description |
| Tap | To press or select a control or item (analogous to a single mouse click). |
| Drag | To move columns left and right or up and down slowly when an In-Document Analytics enabled report is in a grid in full-screen web app view. |
| Flick | To move columns left and right or up and down quickly when an active report is in a grid in full-screen web app view. |
| Swipe | To page forward or backward in a pagination bar when an In-Document Analytics enabled report is in a grid in full-screen web app view. |
| Double tap |
To zoom in and center a block of content or an image. If you are already zoomed in, a double tap zooms out. You can also double tap the screen to hide both the top and bottom toolbars, as well as the pagination bar. Double tap the screen again to show both toolbars and the pagination bar. |
The following table lists and describes gestures specific to mobile charts.
| Gesture | Description |
| Tap | The tap gesture is used to select or highlight an item, such as a riser, and show its tooltip (analogous to pausing the mouse over an object). |
| Long touch | Touching and holding an item, such as a riser, is used to trigger a dropdown menu on events that support it (analogous to a single mouse click). |
| Short drag |
Can be used interchangeably with long drag for either scrolling (on charts with scroll bars or moving around on maps) or for marquee data selection.
|
| Long drag |
Can be used interchangeably with short drag for either scrolling (on charts with scroll bars or moving around on maps) or for marquee data selections.
|
With In-Document Analytics on a mobile phone, for example, you can review reports and charts, as well as those that are spawned from another report or chart. This makes viewing data highly interactive and useful. The following image shows a report and a spawned chart, depicting different views of the same data.
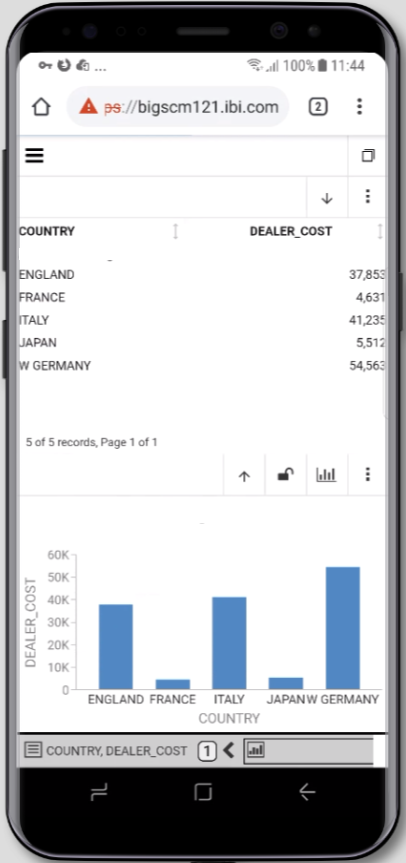
Using this approach, you can easily analyze your data and make quick decisions.
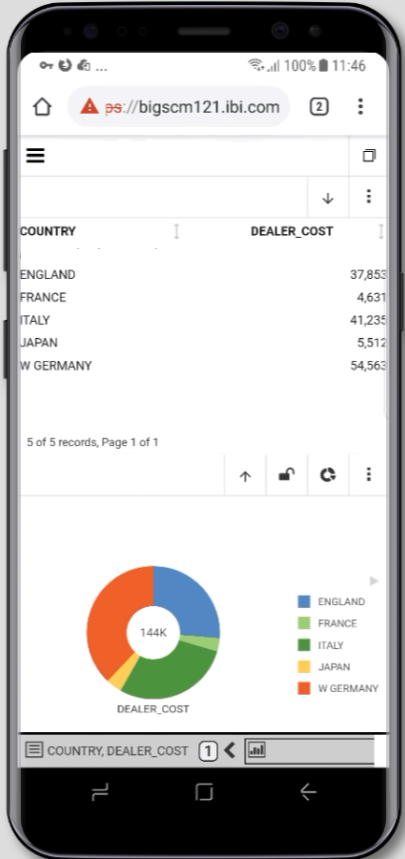
You can also change the chart type of the spawned chart by tapping on the chart type icon, as shown in the following image.
Interacting with In-Document Analytics reports on a mobile device is user-friendly and intuitive. You can turn your device horizontally to maximize the view. For any report, there is a pagination bar that enables you to page through your report easily. Located at the bottom right of the report, you can use the arrows to navigate back and forth between pages. You can also position this bar at the top of the report if you find this way of navigating easier. You can adjust the viewing mode, which can be either full-screen web app view or original In-Document Analytics view.
When viewing interactive content on a smartphone where the size of the screen of the measures 400 pixels, your content will always display in Full screen mode, even when you switch between portrait or landscape views. This occurs to maximize your view of the output.
Note: To view an interactive report on a smartphone where the size of the screen measures 400 pixels (for example, Samsung Galaxy S8®), and you switch between portrait and landscape modes, you must run the output in Fullscreen mode.
When working with a report, you can access the column menu by tapping on a column heading. The column menu enables the charting, rollup, and pivot tools which allow you to further analyze your data. You can also utilize the other features of the column menu, including filters.
Filters allow you to narrow the scope of your data. For example, you can select just the items that you want to display. This lets you focus your view on the data that is most important to you. You can also highlight rows of data, giving you the opportunity to showcase a data element that is of importance to you or your audience.
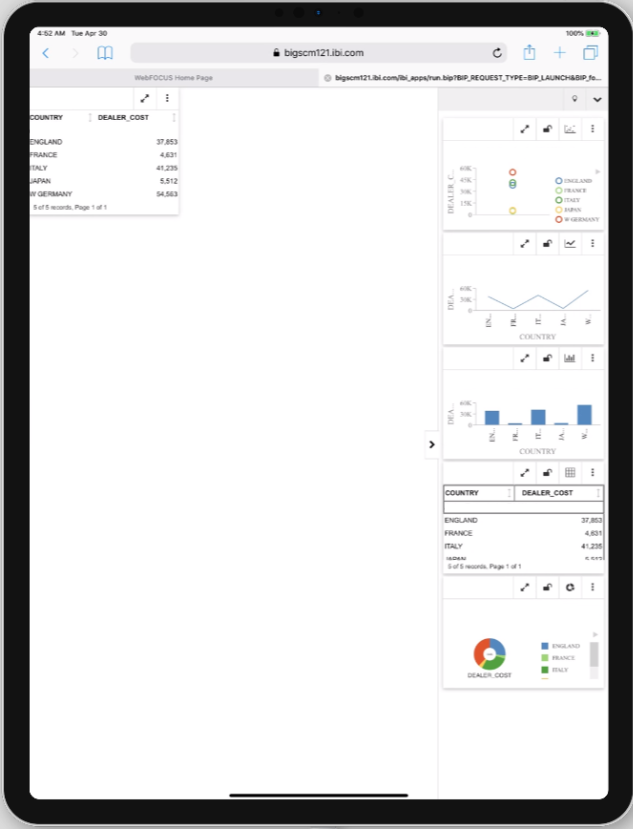
Mobile devices also support the view of multiple spawned reports at the same time. This eliminates the need to scroll or swipe through multiple charts while interacting with your data. The following image, shown on an Apple iPad, shows multiple spawned charts and grids, providing you with different views and ways to analyze your content.
For more information and specifics on interacting with In-Document Analytics content, see the In-Document Analytics topics in the KnowledgeBase.
- Release: 8207
- Category: Visualization and Analytics
- Product: In-Document Analytics
- Tags: How-to's