Using the Performance Log to Track Schedule Performance
You can use the performance log to analyze the resource utilization of schedules with ReportCaster. This log records the processing duration of individual schedules and schedule components.
To access the performance log, navigate to the ReportCaster Console. On the ribbon, in the Manage Server group, click the Server Status tab. Then click the Server Log drop-down arrow to view the Server Log menu.
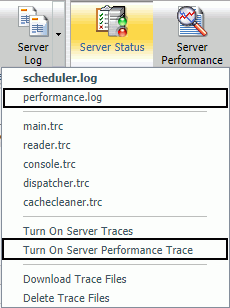
The performance log feature is turned off by default. To activate performance log recordings, click Turn On Server Performance Trace.
The performance.log and Turn On Server Performance Trace options are shown in the following image.
The performance.log records the following information in each record:
- Job ID
- Schedule ID
- Schedule Name
- User ID
- Time
- Type - (Begin, End)
- Event - (QUEUED, JOB, WF_REPORTING_SERVER, DESTINATION_MAPPING, COMPRESSION, EMAIL, FTP, LIBRARY, REPOSITORY, PRINT)
- Source - (Schedule ID, Task ID, Distribution ID)
- Server Name - (EDASERVE, IBIMAIL, FTP Server Name, Print Name…)
- Server User - (Execution ID)
- Object - Scheduled fex
- Release: 8205
- Category: Scheduling and Distributing Content
- Product: ReportCaster