8206


Video: How to Sort Dynamic Prompts

Hello and welcome to this video on sorting Dynamic Prompts. This feature makes it easy to sort values that display at run time within dynamic prompts in either ascending or descending order. This is particularly useful for numeric values to place the highest or lowest values at the top of the selection list. This is also useful for dates to choose whether the date values will be presented with the most recent at the top or at the bottom of the list. You can also specify sorting for categorical values with ease using Dynamic Prompts.

Video: How to Sort a Stacked Bar Chart

This video will show you a new way to organize your data by creating a stacked bar chart, sorted by the total length of each bar rather than by segment. This procedure also works with other bar, line, and area chart formats.

Video: How to Customize a Report

InfoAssist provides many options for styling reports, to enhance them and make your data stand out.

Once you’ve added some data to your report, you have access to plenty of styling and formatting options.

On the Home tab, you can change the font style, including its size and color, or add bands to the report. The bands make it easier to differentiate rows and tell which values go together.

You can also add a header or footer, which shows up on each page of your report at the top or bottom, respectively. You can also add other features like column or row totals.

Video: How to Create Virtual Fields to Add Conditions to Your Data

Today we’ll take a look at how to create a virtual field, which is a temporary field that can be used to create content.  A temporary field‘s value is not stored in the data source, but can be calculated from it or assigned an absolute value. They are created as needed, and take up little storage space on the server, making them a great way to adapt your data on the fly.

Suppose you find useful insight in your data that isn’t directly represented by any of its fields. You can create a temporary field to bring that information to light, right alongside the rest of your data.

Video: How to Create a Matrix Chart

Today we will introduce how to create a matrix chart, which splits information across rows and columns, in a grid format.  It is a powerful, comparative, tool, which provides a quick glance of trends over time. 

Matrix charts are a great way to identify patterns in your data quickly. By comparing the size or frequency of chart segments, you can immediately determine which values are the most important, or need the most attention, allowing you to investigate the circumstances at play and discover their root causes.

Automatically Advancing Slides in a Carousel Container

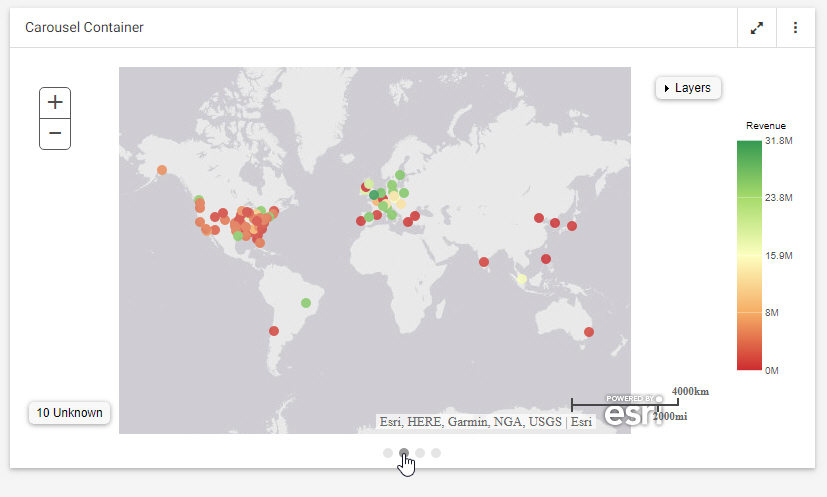
Using a carousel container is one way to put multiple charts, reports, and other content items into a single container. Carousel containers include an unobtrusive control that allows users to cycle through the items added to it, as shown in the following image.

Unlike tabbed or accordion containers, carousel containers also include the option to autoplay the content within them, allowing you to show all of the content in the carousel container without requiring user interaction.

Changing Field Formats in a Report

Changing the display format of fields in a report allows you to control how values in a field are interpreted and the styling that they use when displayed. This feature allows for field display formatting, which is essential for any data-based content design tool.

To change the format of a field in a bucket in the Display pane, right-click the field and point to Format data, as shown in the following image.

Using Hidden Fields in Reports

When creating a report in WebFOCUS Designer, you can hide a field so that it exists in the report but is not shown as a column. The main advantage of doing this is that hidden fields are still used for sorting, which gives you more control over how the values in a report are displayed and organized. To hide a field in your report, right-click a field and click Hide. The hidden field appears slightly faded in its bucket, as shown in the following image.