Using the Vertical Ellipsis Menu to Perform Common Tasks
When working with interactive content that uses the Designer style of In-Document Analytics, the vertical ellipsis menu contains the most commonly used features. For example, you can easily create a new report or chart from this menu.
The vertical ellipsis menu is located at the top-right of the user interface, and is indicated by stacked black dots, as shown in the following image.
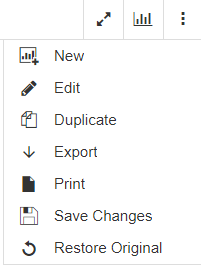
When the vertical ellipsis menu is expanded, the following items display:
New. Launches a Designer canvas, where you can place the data into corresponding buckets to create a new component.
Edit. Opens the component in a modified Designer canvas so you can edit it.
Duplicate. Creates a copy of the component that you can modify.
Export. Exports the data for your report, table or chart to your Downloads folder. The supported export options for charts include Data to Excel, CSV, and PNG. The supported export options for reports include Excel, CSV, and HTML. In addition, when you filter an interactive component during run time, you can choose to export all records or only the filtered records. You can also multi-select different export options.
Print. Launches a window, with options that enable you to print the component. When you filter interactive components during run time, you have the option to print the entire component or only the filtered records. The Print button launches your browsers Print dialog box where, you can set up your page for printing.
Save Changes. Saves your current chart output in its current state to the Downloads folder of your machine with a default name of ARsave.html and a Coordinated Universal Time (UTC) date time stamp. Save changes is only available on the vertical ellipsis for the original component.
Restore Original. Returns the component to its original state.
To close the vertical ellipsis menu, click it again.
When you have duplicated or spawned a report or chart from another one, the vertical ellipsis menu on the duplicated item displays an option to close your component, as shown in the following image.

Note: The Save Changes option is not available on a spawned component.
You can also lock or unlock a new component. Located on the toolbar, the Lock / Unlock option locks or freezes the report or chart. If you have multiple reports or charts that have been spawned from another, each individual report or chart will have its own Lock / Unlock option.
- Release: 8206
- Category: Visualization and Analytics
- Product: In-Document Analytics
- Tags: How-to's