Creating Content


Using Your Extension in a WebFOCUS Request

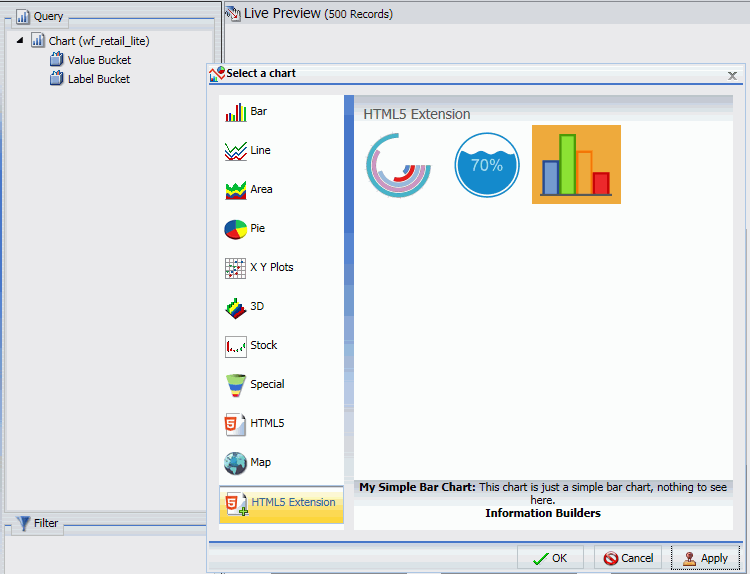
If you have installed and configured your extension as described, your extension will be available for use in the WebFOCUS tools as a chart type. When creating a chart using InfoAssist, charts are available in the Other format category under HTML5 Extension, as shown in the following image.
When creating a chart using WebFOCUS Designer, chart extensions are available in the Custom category when you expand the chart picker, as shown in the following image.

Using the Chart Extension API

To see examples of everything that the chart extension API provides, look at com.ibi.simple_bar.js. It is divided into two main parts, chart rendering and extension configuration.

If you implement the extension API version 2, you can retrieve the field name and number format associated with a data bucket entry. To use API 2 and get a bucket entry field name or number format, an extension must declare that it implements extension API version 2 using the 'implements_api_version' entry in the info block of properties.json:

Creating a Chart Extension

This section summarizes the build cycle for creating an extension and the structure and components of an extension.

Reference: Build Cycle for Writing an Extension

Creating an extension often involves cycles of writing, running, and then debugging code.

When you make changes to the properties.js file for your extension, you need to clear the WebFOCUS cache in order for those changes to be recognized. Clear the cache using the Clear cache link in the WebFOCUS Administration Console.

Creating Thumbnails of a Chart

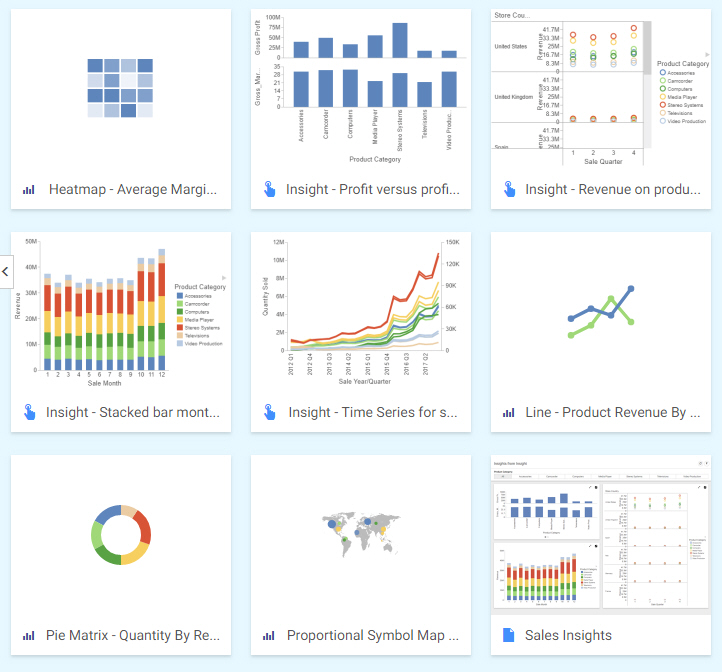
A thumbnail is an image associated with a file that can be used to visually identify it in your WebFOCUS repository. When you create a thumbnail for a chart in WebFOCUS Designer, the thumbnail shows a snapshot or small image of the chart that is then used on the WebFOCUS Home Page. The following image of the grid view on the WebFOCUS Home Page shows some files that use thumbnails created in WebFOCUS Designer, and some files that use the default thumbnail.

WebFOCUS Home Page grid view

Video: Enabling Hierarchical Drilling

Auto Drill is a feature that enables anyone who views the chart to see related data by navigating field hierarchies.


You can use Auto Drill in charts using any data source with field hierarchies. Enabling Auto Drill is easy. In a chart, for example, simply create the chart using a field that is part of a hierarchy and, from the More menu, turn on AutoDrill.

Working With Large Data Sets

With WebFOCUS Designer, you can create content from very large data sets, which enables you to visualize and identify possible outliers or analytics that you may not see clearly in tabular report. There is no hard limit to the amount of data points that WebFOCUS can render on a chart.

Begin by connecting to your large data set or uploading it to WebFOCUS. The following image shows a large health care data set found on the web, mid-upload in WebFOCUS. It also highlights the number of rows that are available in this comma delimited (CSV) file.

Accessing Document Mode

In Document mode, you can:

  • Build a new document.
  • Open an existing document.
  • Generate a new document from an existing single report.

A blank InfoAssist canvas in Document mode is shown in the following image.

Blank InfoAssist Canvas in Document View

Procedure: How to Access Document Mode to Build a New Document

You can build new documents by accessing Document mode from the InfoAssist splash screen.