Creating Content


Adding a Custom Geographic Role

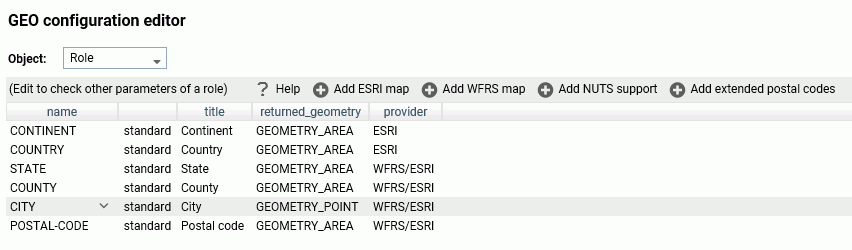
The GEO configuration editor In the Reporting Server Console provides a tool for editing or adding properties for geographic roles.

Click Workspace on the sidebar. Click Settings, point to Geo Services, then click Edit Configuration. The GEO configuration editor opens displaying the configured geographic roles, as shown in the following image.

A Brief History of Mapping

An early example of how maps can be used to illustrate trends is the case of Dr. John Snow, an epidemiologist who was one of the first to use data to map occurrences of cholera to find the cause of infection. By plotting the cholera data on a map of a town, Dr. Snow was able to visualize a trend that showed higher incidences of cholera closest to water pumps. This example is shown in the following image.

Creating Maps to Illustrate Trends

You can create maps to identify patterns or trends in your data. By converting data into values that can be displayed on a map, you are able to visualize scenarios, illustrate hot spots, and identify potential problem areas. For example, a law enforcement agency may use mapping functionality to identify areas of higher crime within the locations they cover. You can also use maps to determine how places are related, understand where things are located, and identify the best actions to take.

Using Insight in Phone Mode

Phone mode, which is available in Insight, allows you to take advantage of the features of Insight on your phone. The interactive heading that is available in Insight on a tablet or desktop is replaced by a static heading that displays the field names in the chart, in blue text. These become summary fields that allow you to see what fields are included in the chart.

Running an Auto Link Enabled Chart

AutoLink is supported from any WebFOCUS repository content, wherever it is run online.

Example: Launching an AutoLink Enabled Report From the WebFOCUS Home Page

From the WebFOCUS Home Page, right-click a chart that is Auto Link enabled, and then click Run.

Example: Using Hyperlinks to Link to Other Reports or Charts

Use the hyperlinks to link to other reports and charts, based on the following information:

Using Optional Parameters With Auto Linking to Enhance Drilldown Results

In addition to the basic Auto Linking functionality that is available in WebFOCUS Designer, you can also add optional parameters to your Auto Link charts, extending the capability of this feature. An Auto Link enabled chart can link to any target content that you are authorized to access that satisfies the sort (BY) field to the Auto Link target report filter parameter requirement.

Enabling Automatic Content Linking With Auto Linking

Auto Linking makes it easy to connect reports and charts in your development environment, expanding the reporting capabilities of your organization. Using Auto Linking, you can dynamically link HTML5 charts with a single report or chart of any format, based on their common sort (BY) fields and parameters referenced in any filters. It is this commonality that dynamically links content in your WebFOCUS repository, allowing you to discover new possibilities in your data, and explore new relationships within your reporting enterprise.

Enabling Hierarchical Drilling

Auto Drill enables you to navigate through different levels within the dimension hierarchy of your data source. This allows you to review underlying data for a particular area, and move through the structure of your data source based on your informational needs.

To enable Auto Drill, on the WebFOCUS Designer toolbar, click More, and then click AutoDrill.