Creating Content


Formatting Series in a Chart

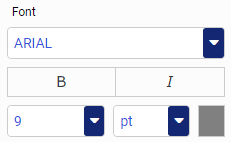
A series, which is a set of data, represents the set of values for one field in the request (for example, a measure). These numbers are plotted in a chart. You can format the series in your chart, which includes font formatting, display options for labels, and other options, including the ability to hide overlapping labels. Using the Series options, you can select a specific series in a chart to which to apply changes, or you can select All Series, which applies changes to all series in the chart.

Using Axis Options in a Chart

Depending on the chart type (for example, bar chart), you can format the axes to customize the display of the information. This includes items such as labels, titles, and font formatting. For example, you can choose to hide the labels in your chart or format the font to add clarity to your chart. You can easily customize the X and Y axis with options that suit your needs.

Adding Headings and Footings to a Chart

You can use headers and footers to add key information, such as purpose of the chart and the audience. For example, if you have gross profit for different product categories, you can add a header to highlight this information in your chart.

You can add multiple lines of information into the heading and footing areas in a chart. This accommodates thorough explanations and additional information while offering the most readable presentation.

Controlling Font Display in a Chart

You can use the font formatter in WebFOCUS Designer to control how fonts are displayed in your chart. This is a quick way to apply styling, colors, or a specific font type for any text within your chart. The font formatter displays in different areas of the Style tab (for example, Legend, Axis, Series, and Matrix options). Depending on the chart type and what you want to format, you can use these options to enhance the fonts in your charts. The font formatter is shown in the following image.

Formatting Charts in WebFOCUS Designer

Charts allow you to present information graphically, using such visual cues as color, size, and position to convey relationships between measures (numeric fields to be aggregated) and dimensions (categories) and to identify trends and outliers. You can create a wide variety of charts. For example, you can review your data (Gross Profit and Product Category) using different chart types (for example, bar chart, area chart, or line chart). The chart options give you an edge in deciding which chart to use.

Video: Formatting Maps

Welcome to this video on formatting maps in WebFOCUS Designer. You can create maps to identify patterns in your data. Data is converted into values that can be displayed on a map, making it easy for you to visualize scenarios, illustrate hot spots, and identify potential problem areas.

There are two types of maps: Choropleth and Proportional Symbol (Bubble). Choropleth maps are useful for visualizing location-based data, trends, and distributions across a geographic area. Bubble maps focus on specific areas. The size of the bubble varies depending on the underlying data.

Video: Grouping Numeric Values with Binning

Welcome to this video on Binning, where you can group numeric data values to plot the frequency distribution of values in your data. Bins are a standard data analysis technique. With bins, you group number values in continuous increments that you control. This lets you summarize large amounts of data across measures, and lets you analyze trends and quickly identify outliers.

Video: Creating Calculations

When you create a chart, you are not restricted to the fields that exist in your data source. You can create calculations from the data that exists to automate summations and other mathematical tasks related to your data fields. You can specify operators, fields, variables, and functions when creating a calculation. A calculation takes up no storage space in the data source, and is created only when needed.

You can create the following types of calculations: