A Brief History of Mapping
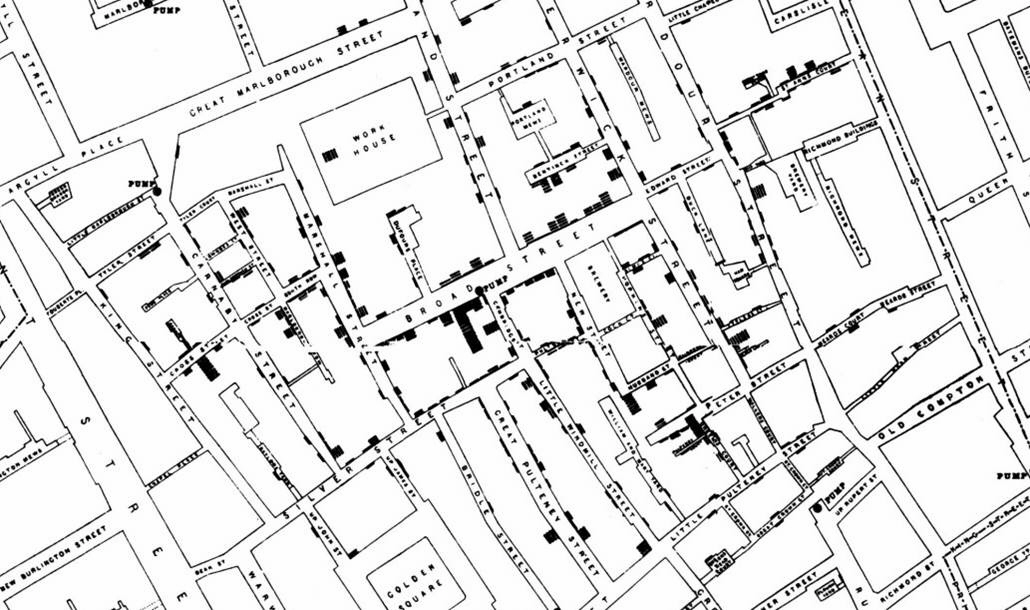
An early example of how maps can be used to illustrate trends is the case of Dr. John Snow, an epidemiologist who was one of the first to use data to map occurrences of cholera to find the cause of infection. By plotting the cholera data on a map of a town, Dr. Snow was able to visualize a trend that showed higher incidences of cholera closest to water pumps. This example is shown in the following image.