Creating Numeric Ranges
In WebFOCUS Designer, bins are used to group values by the increment you specify. This allows you to view large amounts of data across measures or calculated measures, enabling you to analyze trends and identify outliers. Data binning also allows you view your data as part of a larger group, displaying ranges of that data in manageable, visible bins.
For example, you might want to analyze Cost of Goods Sold against Discount to understand how discounts impact the cost of goods. First, you add the Discount measure to the Vertical field container. These values will be used as a guide for the comparative, grouped content in the bin. If you apply a bin width value of 250 to the Cost of Goods measure, your data values will be grouped into ranges of 250 (for example, 0 - 250, 250 - 500, 500 - 750). Finally, you add the new dimension (which is automatically generated by the bin process) to your chart. Your chart now displays the binned values against the Discount measure, as shown in the following image.

As you can see in this example, there is a direct correlation between Cost of Goods and Discount, with the smaller values (0 - 250) falling into the larger Discount ranges. From this example, it is evident that the smaller ranges of values for Cost of Goods apply to the larger Discount values. In this case, binning has allowed you to plot the frequency distribution of values in your data.
Bins are created on a numeric measure field (for example, Gross Profit), as shown in the following image.
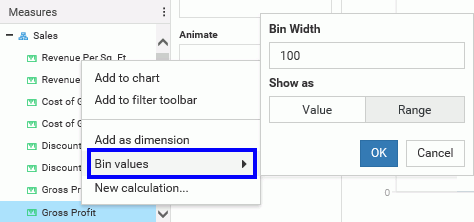
Examples of numerical measure fields include Gross Profit or Discount. Once you create a bin, a new dimension field is automatically created, allowing you to plot values based on your bin specifications.
Note: You can create or edit bins using the same options. Right-click a field that is not already binned, and click Bin values, or right-click a binned field and click Edit bin values. This opens a shortcut menu with the following options:
- Bin width. A standard text box that accepts any number greater than 0.
- Show as. Identifies the bin label type.
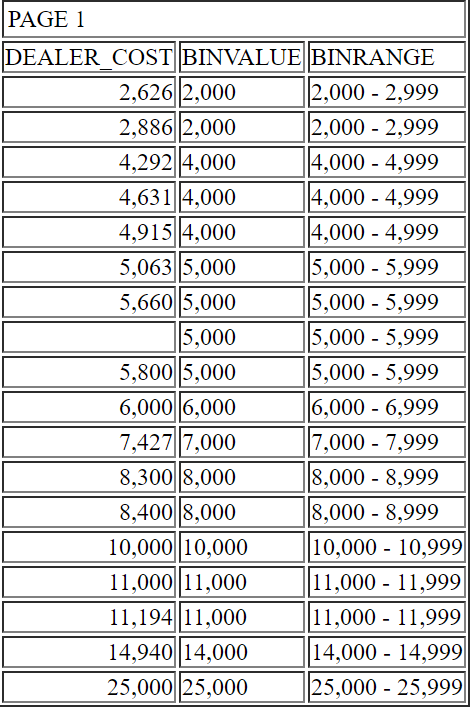
- Value. Displays the alphanumeric representation of the numeric value containing the minimum value (FLOOR) of each bin. The format should be set to the data format of the source field.
- Range. Displays the alphanumeric string representing the minimum and maximum range for each bin. The format should be set to the data format of the source field.
- OK. Creates a new dimension field based on the bin options that you selected. This dimension field is automatically added under your dimensions in the Fields tab.
- Cancel. Closes the shortcut menu and cancels the changes.
The following image displays bin values and bin ranges for the DEALER_COST field, using a bin width of 999. It also shows how the data falls into the value and range properties.
Procedure: How to Create Bins
- From the WebFOCUS Home Page, click the Designer tab, and then click Chart.
- As WebFOCUS Designer opens, choose a data source, and then click Select.
- On the Fields tab, under Measures, select a numeric measure field and place it in the Vertical field container. You can also double-click the field, or right-click it and select Add to chart.
- On the Fields tab, under Measures, right-click another numeric measure field and select Bin values.
- Specify a numeric value in the Bin width field. For example, using the numeric value 100 creates bins that group values of 100 together.
- Click OK to generate the bins for this numeric measure field.
Note: The binned measure is added as a new dimension field that you can use in your chart.
- From the list of dimension fields, locate the field that is suffixed by _US_BIN_1 (for example, DISCOUNT_US_BIN_1).
Note: The binned field is placed under Dimensions on the Fields tab. If you are viewing these fields using the Folder view, it will be available under a folder with the same name used under Measures. You can also use the search feature to locate the new dimension field if needed.
- Add this new dimension field to the Horizontal field container.
The bins display in your chart, showing values in the range that you specified.
- Release: 8205
- Category: Creating Content
- Product: WebFOCUS Designer
- Tags: How-to's