Creating New Content in WebFOCUS Designer Using Sample Data
To create new content in WebFOCUS Designer using sample data, open the Data folder in the Retail Samples domain. Right-click one of the available data sources (for example, Store Product Data), select New, Designer, and click either Workbook or Chart from the context menu, as shown in the following image.
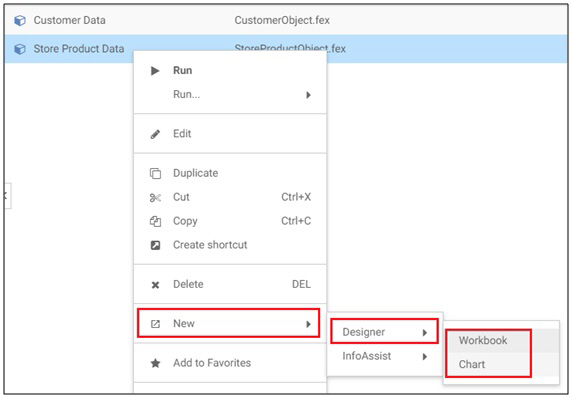
Note, for demonstration purposes, this example uses the Chart option as an example.
WebFOCUS Designer opens in Chart mode, as shown in the following image.

Click the Vertical Stacked Bar chart type from the chart picker, which is located in the right pane, as shown in the following image.

Add one or more measures and dimensions from the Fields panel located on the left pane to the chart. The vertical stacked bar chart refreshes with your selections, as shown in the following image.

To obtain a different view of this sample data, click the Absolute Line chart type from the chart picker, as shown in the following image.

The vertical stacked bar chart is automatically refreshed as an absolute line chart, as shown in the following image.

Let's quickly change the dimension field in the x-axis, so you can see how your sales-related measures performed over time. For example, drag the Sale,Year/Month dimension to the Horizontal bucket, as shown in the following image.

The absolute line chart refreshes accordingly, as shown in the following image.

To save your work, click the Save icon on the toolbar, as shown in the following image.

- Release: 8206
- Category: Introducing WebFOCUS Designer
- Product: WebFOCUS Designer