Exploring and Modifying Retail Samples Content Using WebFOCUS Designer
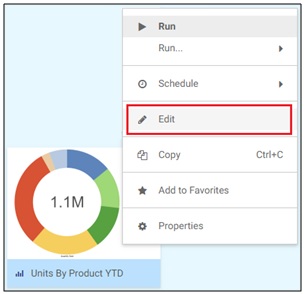
To explore and modify Retail Samples content using WebFOCUS Designer, open one of the subfolders in the Designer folder (for example, Product). Right-click on a chart (for example, Units By Product YTD) and select Edit from the context menu, as shown in the following image.
The selected chart opens in WebFOCUS Designer, as shown in the following image.

You can now modify and enhance this chart using any of the facilities available in WebFOCUS Designer. For example, you can quickly convert this ring pie chart to a vertical stacked bar chart to obtain a different view of this sample data. Click the Vertical Stacked Bar chart type from the chart picker, which is located in the right pane, as shown in the following image.

The ring pie chart is automatically refreshed as a vertical stacked bar chart, as shown in the following image.

To add color to your vertical stacked bar chart and visually distinguish the product category values, drag the Product,Category dimension from the Dimensions pane on the left to the Color bucket, as shown in the following image.

You can add or remove additional measures and dimensions as required. If you are satisfied with your changes, you can click the Save icon on the toolbar, as shown in the following image.

- Release: 8206
- Category: Introducing WebFOCUS Designer
- Product: WebFOCUS Designer