Using Retail Samples
A sample WebFOCUS domain called Retail Samples is included in your environment to help you quickly get started. The Retails Samples domain allows you to explore sample data, sample content that was created using WebFOCUS Designer, and quickly develop new content.
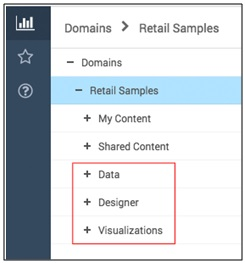
The Retail Samples domain includes the following folders containing sample content, which you can access:
- Data. Contains the Store Product Data sample data source that you can select and use to create additional content using WebFOCUS Designer.

- Designer. Contains subject-specific content (for example, charts) that was created using WebFOCUS Designer. This content is organized into four subfolders (Customer, KPIs, Product, and Store), as shown in the following image.

- Visualizations. Contains three sample data visualizations that combine a variety of WebFOCUS analytical content (for example, charts and maps) on a single screen, which allows you to dynamically interact with your data.

Open any of these subfolders to explore the sample content that is available. For example, the following image shows a variety of sample charts in the Product folder.

To run one of the charts, simply right-click on a chart (for example, Gross Profit v. Costs analysis - Bins of 250) and select Run from the context menu, as shown in the following image.

The Gross Profit v. Costs analysis - Bins of 250 chart runs directly in your browser window, as shown in the following image.

To close this chart and return to the WebFOCUS Home Page, click the X icon in the upper-right corner.
- Release: 8206
- Category: Introducing WebFOCUS Designer
- Product: WebFOCUS Designer