WebFOCUS Designer and Esri Integration
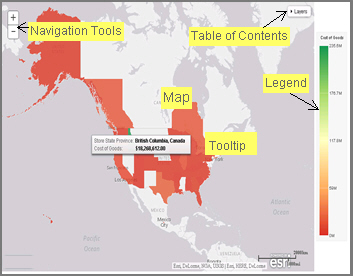
Using WebFOCUS Designer with the Esri integration, you can create maps that help you illustrate or identify trends so you can take action quickly. WebFOCUS architecture provides the framework in which this system operates. Using a JavaScript map viewer, you can navigate the interface easily, as shown in the following image.
In addition, this integration utilizes the capabilities of Esri by leveraging the ArcGIS JavaScript API and content. Specifically, you can integrate data into maps with published content in ArcGIS Online platform. For more information, see http://www.esri.com/software/arcgis/arcgisonline. Additionally, by using this integration, you can include information about demographics, spending habits, crime, and lifestyle to maps that contain your data. These maps include layers with extensive demographic or reference detail and topography and allow you to view information about people, businesses, climate, and much more.
You can create the following maps in WebFOCUS Designer:
- Choropleth. A common thematic map that uses geographical measures (for example, states and countries), representing the values aerially while employing a varying intensity of colors. It is useful for visualizing location-based data, trends, and distributions across a geographic area. The color hues for Choropleth maps are dictated by the legend, based on the selected measure, enabling you to determine data concentration across your map.
- Proportional Symbol (Bubble). A map that represents coordinates, such as an address or intersection, using symbols of different sizes to represent any measure. These maps focus on specific areas, for which data concentrations may vary. When the data concentration is larger, the bubble will be bigger.
In addition, built-in zooming capabilities allow you to drill down to a specific geographic area of focus easily. This allows you to get a closer look at regional or local data, draw inferences, and make recommendations, without changing the initial view of your data.
Using the Esri integration in WebFOCUS Designer, you can also add the following layers to your map:
- Backgrounds. Display a layer that positions data as it is located, in context to other geographical features, such as streets, terrain, and imagery. Some standard Background options may combine road, aerial, and topographic data using a variety of symbols. Hosted on ArcGIS, you can change your background at any time, to review your data in a different context.
When you apply a Background to your map, its appearance changes. You can then adjust the view of your data, showing different terrain or geographical views. Backgrounds provide at least 17 levels of zoom. For more information, see https://developers.arcgis.com/javascript/jsapi/esri.basemaps-amd.html.
The basemap options include:
- Light Gray Canvas Map
- Dark Gray Canvas Map
- World Imagery with Labels
- National Geographic World Map
- Oceans Map
- Open Street Map
- World Imagery
- World Street Map
- Terrain with Labels
- World Topographical Map
- Reference Layers. Display a layer of boundaries and locations that range from a continental scale to country, state, and even local neighborhood. For example, if you are viewing World data on electricity usage, you may want to add a Reference Layer that displays the borders and concentration of your data within each country.
- Demographic Layers. Display a layer of information about people and businesses in a specific demographic area. This includes the United States and 120 other countries. Demographic Layers are thematic maps that provide additional information about the location, such as spending habits, population, and lifestyles. You can add Demographic Layers to a map about sales data, to identify new locations for stores, based on the spending habits for a specific area.
Both mapextent and the Layers menu functionality are applied to your map when you select a Background, Reference Layer, or Demographic Layer. Mapextent is an automatic view of the map. Layers is a menu that appears on the map and provides access to options that allow you to adjust the information that is being displayed.
The map example in the following image shows the use of layers.

Note: Backgrounds, Demographic Layers, and Reference Layers can be accessed from the Style tab. These layers are static, standard options that Esri provides for use with WebFOCUS Designer, and do not change based on the data source that you select.
Reporting Server Configuration for Demographic Layers
In order for Demographic Layers to draw, you must configure the Reporting Server to enable them.
Note: This is a critical step for displaying secured Demographic Layers.
Procedure: How to Configuring the Reporting Server to Enable Demographic Layers to Draw
- From the WebFOCUS Home Page, click Administrator and then click Legacy Home Page.
- From the Reporting Servers node, access the Reporting Server Console.
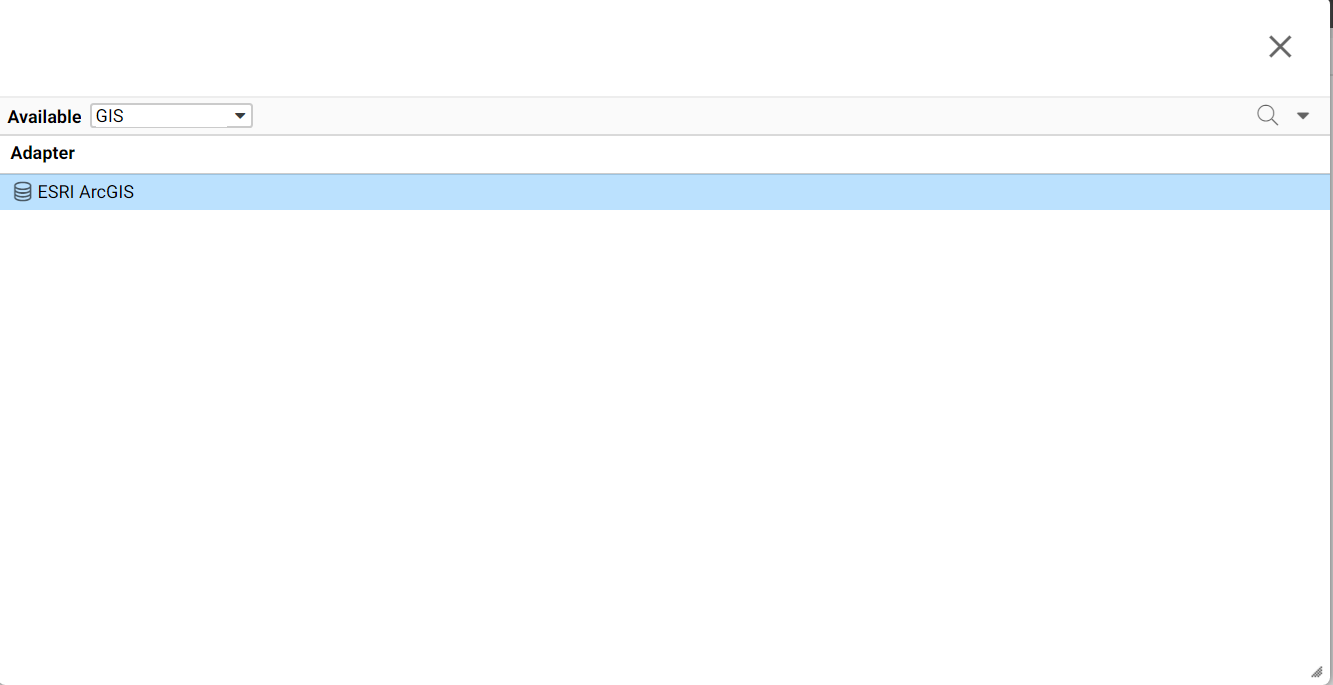
- Click Adapters and then click New Datasource.
- In the Available drop-down in the Adapter dialog box, select GIS and then click ESRI ArcGIS, as shown in the following image.
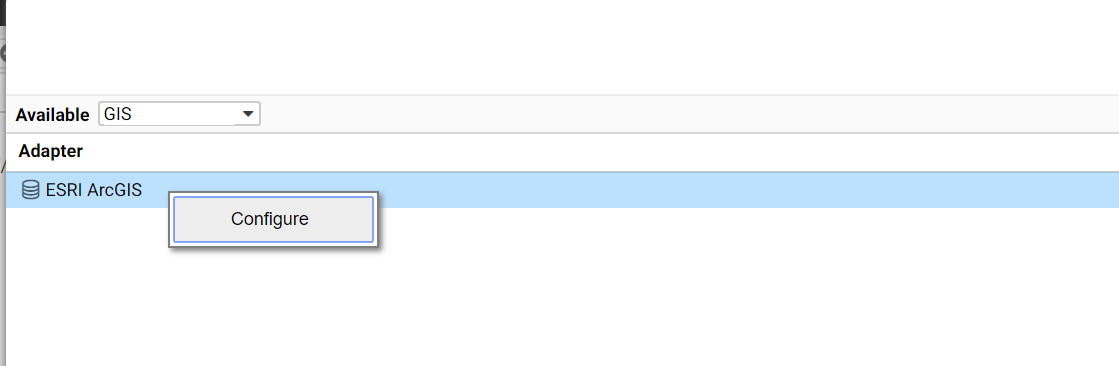
- Right-click ESRI ArcGIS and then click Configure, as shown in the following image.
- In the Environments section, click Configure, as shown in the following image.
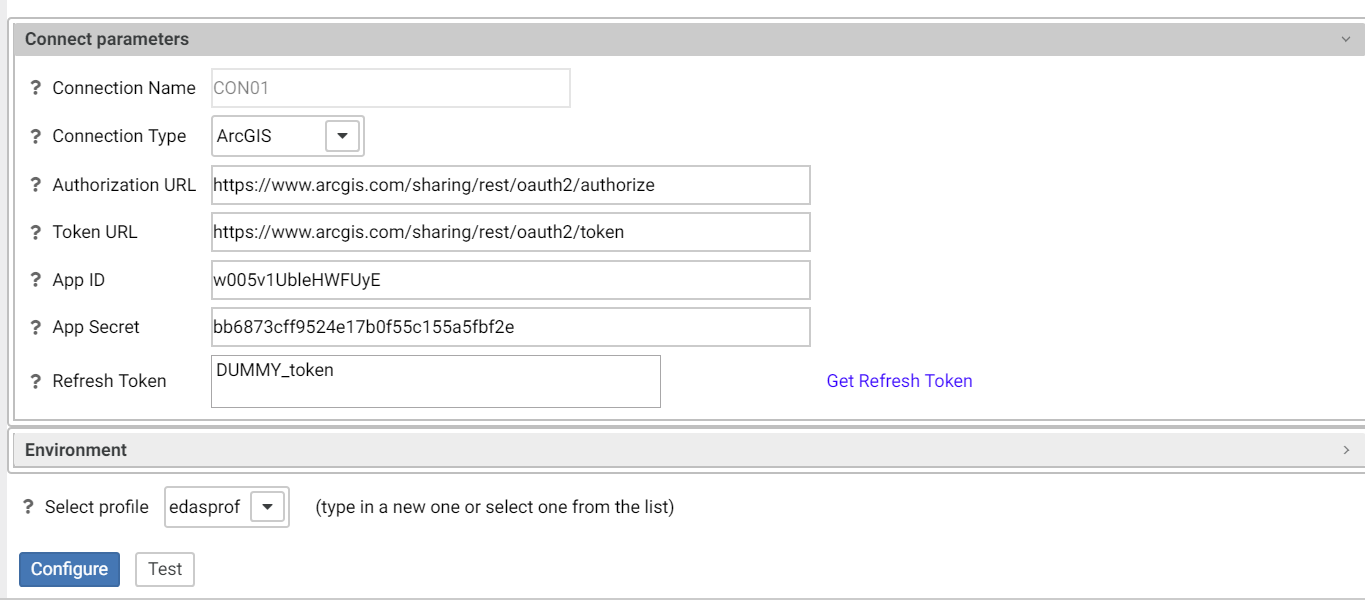
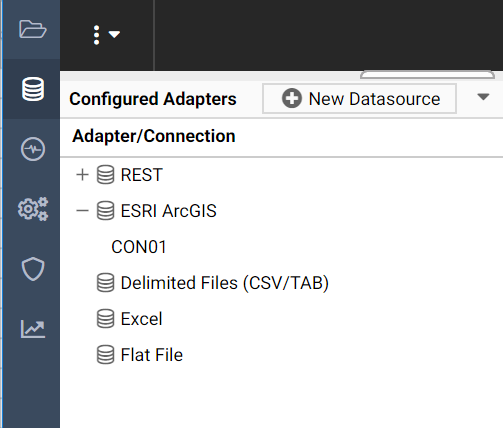
Once this is configured, ESRI ArcGIS shows up under the configured adapters, as shown in the following image.
Configuring an Esri On Premise Environment
The Esri On Premise functionality enables you to download and access mapping files through the use of a local Application Programming Interface (API). Once you download and configure the API, you do not need an internet connection to utilize the robust mapping features that Esri provides.
The Esri On Premise functionality provides you with local access to Esri mapping files. This is particularly useful if you are away from your office or without an internet connection. You may also be using a mobile device, such as an iPad or smartphone with a large screen, without an internet connection. The following mapping components are supported when using the Esri On Premise functionality:
- Offline Basemaps. Basemaps are an offering from ArcGIS. Standard basemaps are provided for your use offline. For example, there is an Oceans basemap and a Terrain with Labels basemap. These basemaps are also known as backgrounds. In an online setting, there are 10 basemaps available. In order to use offline basemaps you need to use a tiled mapservice published in the ArcGIS Server.
- Offline Geographic Roles.Adding a Custom Geographic Role.
Note: Demographic Layers are not supported in an Esri On Premise environment.
Procedure: How to Download and Configure the ArcGIS JavaScript API
You can use this procedure to download and configure the API that controls the Esri On Premise environment.
- In your browser, navigate to the following URL to download the API: https://developers.arcgis.com/downloads
- Sign in to access the download options that are available to you.
- Select Version 3.15 of the ArcGIS API for JavaScript, as shown in the following image.

- Click API to download the API.
- In drive:\ibi\config\web_resource, create a folder named arcgis_api.
- Open the arcgis_js_v315_api.zip file downloaded in step 4 and navigate to arcgis_js_v315_api\arcgis_js_api\library\3.15\3.15.
- Extract the files in that folder to the drive:\ibi\config\web_resource\arcgis_api folder.
- Next, verify the path to the API in the Administration Console, as shown in the following image.
Note: This is the path to which you extracted the API files.

This field identifies the path to the internal ArcGIS Javascript API Source that develops ESRI-based maps. This setting is blank, by default, indicating that the use of the internal API source to develop ESRI maps is not activated. The API that is referenced is https://js.arcgis.com/3.15/, by default. To direct WebFOCUS Designer to use the internal ArcGIS Javascript API to develop ESRI maps, enter the path to the local API files that you extracted into this setting. For more information, see the WebFOCUS Security and Administration manual.
Note: This path should be a relative path that is accessible within the local install.
- Click Save.
- Next, open the following two local API files:
- drive:\ibi\config\web_resource\arcgis_api\init.js
- drive:\ibi\config\web_resource\arcgis_api\dojo\dojo.js
In both files, search for HOSTNAME_AND_PATH_TO_JSAPI. Replace '//' + "[HOSTNAME_AND_PATH_TO_JSAPI]dojo" with '//' + HOSTNAME_AND_PATH_TO_JSAPI + "dojo"
- In the Administration Console, click Clear Cache to clear the browser cache. Your configuration is complete.
Creating and Customizing Maps in WebFOCUS Designer
The following procedures provide step-by-step instructions on how to create and customize maps.
As you create your maps, you can use the following built-in map viewer features:
- You can use the plus (+) and minus (-) symbols,
 , within the map to zoom in and out of different areas of the map. You can also click your left mouse button to zoom in to a specific location.
 - Like all HTML5 visualizations, the highlighted markers and regions on a map support drill, multi-drill, auto-linking, and informational tooltip features.
- You can use the Pan / Selection button to alternate between the Pan and Selection controls. This option is in the upper-right corner of the map.
- Creating a map chart using the US Zipcode 5 Georole with more than 2000 polygons will fail to draw.
Procedure: How to Create an Esri Choropleth Map
Note: The default option of creating a map utilizes the ArcGIS JavaScript API that Esri provides.
- Launch WebFOCUS Designer.
- On the Designer tab, click Chart.
- Select a data source and click Select.
- On the Chart picker, select the Choropleth map chart type.
A blank map displays and the Geo bucket is enabled, as shown in the following image.

- Add a Geolocation field to the Geo bucket.
This field, which already has a geographic role assigned, is denoted with a Geo icon,
 , in the Data panel, as shown in the following image. You can also hover over a data field to view the geographic role assignment.
The canvas refreshes, and your map displays.
- Before saving your map, to add insight, you can also do following:
- Click Run, to preview your map.
- Add a measure or dimension to the Color bucket, to color your chart by that underlying data value. When you add a measure or dimension field to the Color bucket, a legend displays for that data value. If you specify a dimension in the Color bucket, the label changes to Color BY.
- Add a dimension or measure to the Tooltip bucket, which will display tooltip information when you place your mouse over an area of the map.
- Add a Background, Demographic Layer, or Reference Layer.
- Click Save to save your map.
Procedure: How to Create an Esri Proportional Symbol (Bubble) Map
- Launch WebFOCUS Designer.
- On the Designer tab, click Chart.
- Select a data source and click Select.
- On the Chart picker, select Proportional Symbol for the map type.
A blank map displays and the Geo bucket is enabled.
- Place a data field with a defined geographic role in the Geo bucket.
This field, which already has a geographic role assigned, is denoted with a Geo icon,
, in the Data panel, as shown in the following image. You can also hover over a data field to view the geographic role assignment.A basic bubble map displays, as shown in the following image.
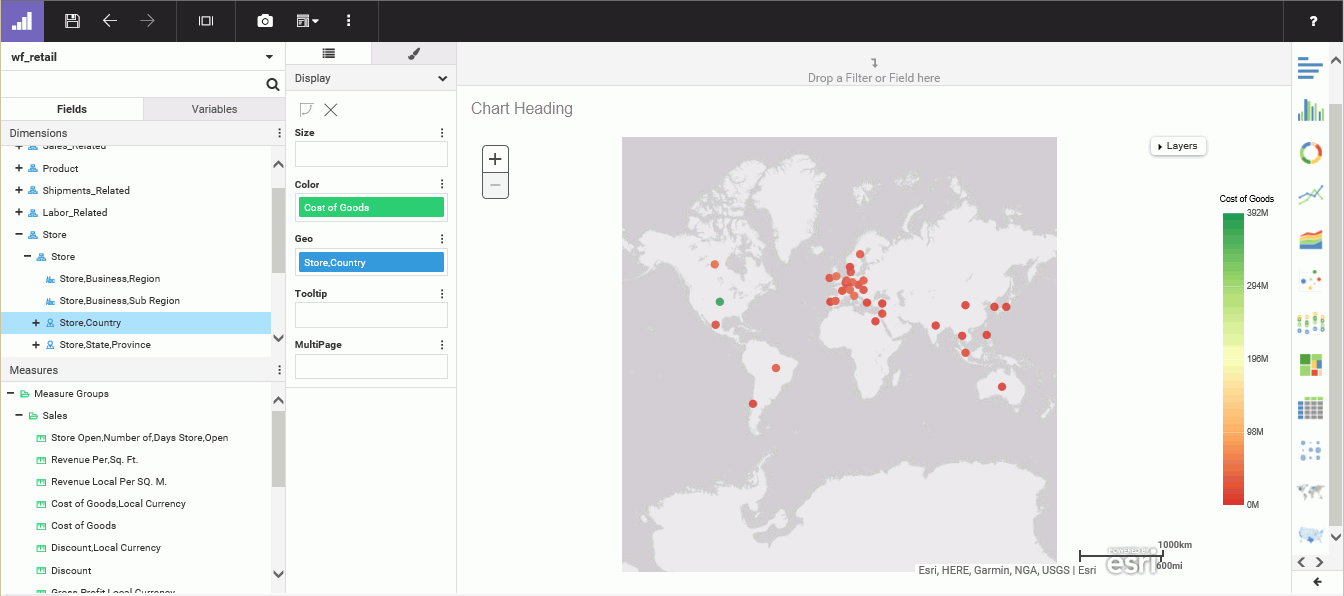
- Before saving your map, to add insight, you can also do following:
- Click Run, to preview your map.
- Add a measure or dimension to the Color bucket to color your chart by that underlying data value.
- Add a measure to the Size bucket, to control the size of the bubbles on your map.
- Add a measure to the Tooltip bucket, to display tooltip information when you place your mouse over an area of the map at run time.
- Add a Background, Demographic Layer, or Reference Layer.
- Click Save to save your map.
Procedure: How to Change the Default Background of a Map
- Create a new map or open an existing map.
- On the Style tab, on the Map options tab, select Base map and choose from the available options, as shown in the following image.

- Select one of the following options:
- World Street Map
- Terrain with Labels
- Oceans Basemap
- OpenStreetMap
- World Imagery
- Imagery with Labels
- Light Gray Canvas
- National Geographic World Map
- Dark Gray Canvas
- None
Note: The Imagery with Labels Background provides the terrain for your map, ranging from land contours to city streets.
Once you make a selection, the background of the map refreshes. You can continue to change your background until it displays the desired information.
Procedure: How to Add Demographic Layers to a Map
- Create a new map or open an existing map.
- On the Style tab, in the Map options group, click the Demographic layer drop-down and select Demographic Layers.
- Select from various population and lifestyle groups, as shown in the following image.
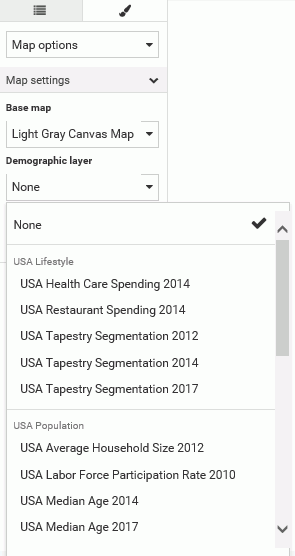
Note: These are pre-defined demographic profiles, provided by ArcGIS. You can select multiple options in either category to gain additional insight into your data. Specifically, each Demographic Layer has its own profile and provides a layering option, when comparing values across different layers or profiles.
- Click OK.
The Demographic Layers that you select are applied to your map. The map engine displays the different groups with unique hues and coloring. You can use the Table of Contents or Layers option, to toggle between the different layers that you have specified. The Layers option is shown in the following image.
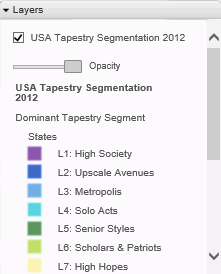
Note: You can select and clear the check boxes to enable the display of one or more Demographic Layers to compare and contrast the different demographic scenarios.
Procedure: How to Add Reference Layers to a Map
- Create a new map or open an existing map.
- On the Style tab, in the Map options group, click the drop-down for Reference layer.
The list of Reference Layers displays, as shown in the following image.
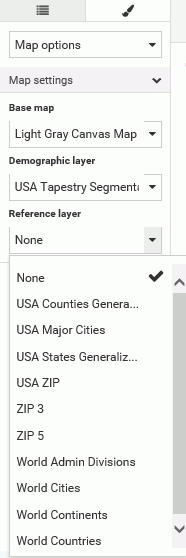
- Select one or more Reference Layers, such as World Countries, to add to your map, and then click OK.
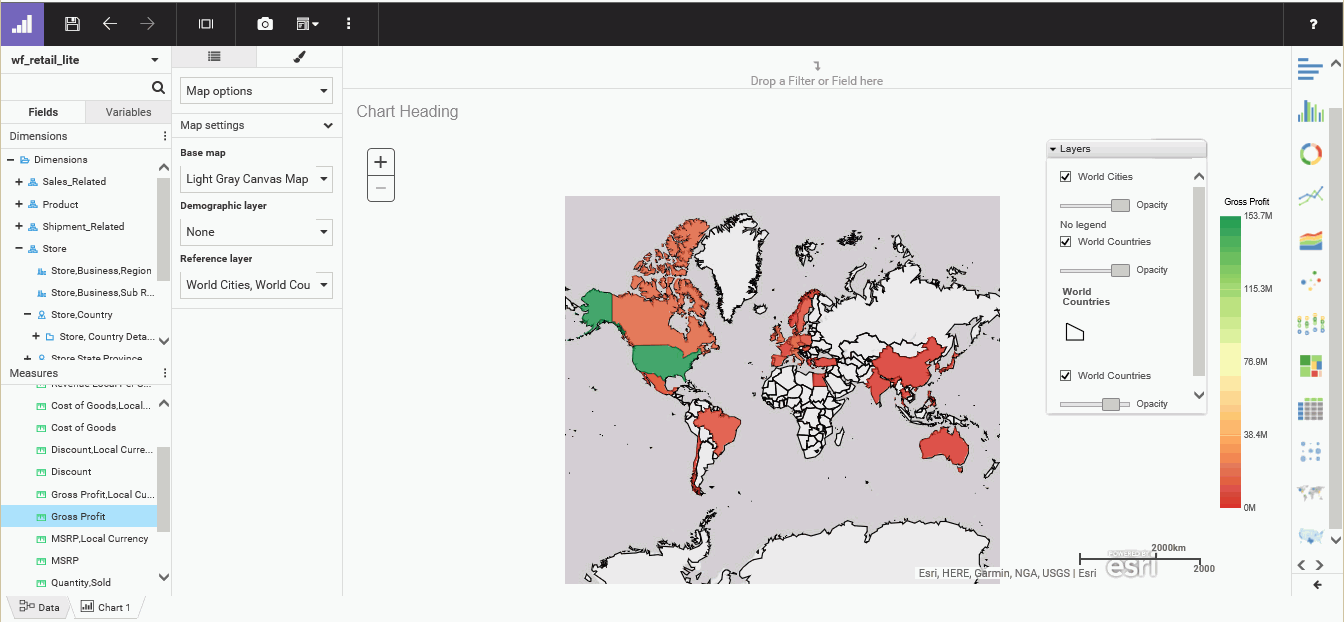
Your map refreshes, and the definitions and borders of the References Layers display on the canvas. You can use the Table of Contents or Layers option, to toggle different Reference Layers in your map. These options are shown in the following image.
Reference: Query Buckets by Map Type
This section presents the Query buckets that display, by map type.
|
Query bucket |
Choropleth Map |
Proportional Symbol Map |
|---|---|---|
|
Geo. One data field, specifically a field containing location data (for example, State). |
|
|
|
Color. One data field. |
|
|
|
Tooltip. Up to one data field (not required). |
|
|
|
Multi-page. Up to one data field (not required). |
|
|
|
Size. One data field. |
|
|


Reference: Geographic Roles
Note: Geographic roles are only available with Esri maps.
This section contains information on the geographic roles that are supported for Esri maps.
|
Geographic Role |
Description |
Maps Supported |
|---|---|---|
|
CONTINENT |
World Continents |
Choropleth, Proportional Symbol |
|
COUNTRY |
World Countries |
Choropleth, Proportional Symbol |
|
STATE |
World Admin Divisions |
Choropleth, Proportional Symbol |
|
CITY |
World Cities |
Proportional Symbol |
|
COUNTY |
World Counties |
Choropleth, Proportional Symbol |
|
POSTAL-CODE |
Postal Code |
Choropleth, Proportional Symbol |
Note: This is a new, simplified list of geographic roles (dimensions) that you can utilize when creating a map chart. This unified list of roles provides worldwide mapping of administrative boundaries down to the postal code level. In WebFOCUS Designer, the new roles display, by default, when assigning a geographic role.
The following table illustrates the geographic roles and their dependencies. Level 1 indicates the highest level of hierarchy and level 5 is the lowest level of hierarchy.
|
Region |
Hierarchy Level |
Geographic Role |
|---|---|---|
|
World |
1 |
CONTINENT |
|
2 |
COUNTRY |
|
|
3 |
STATE |
|
|
4 |
CITY |
|
|
5 |
POSTAL CODE |
- Release: 8206
- Category: Creating Content
- Product: WebFOCUS Designer
- Tags: Release Features