Connecting to Data


Creating Joins in a Reporting Object

A join is a temporary connection between two or more data sources that share at least one common field. After you join two data sources, each time that WebFOCUS retrieves a record from the first data source (the host file), it also retrieves the matching records from the second data source (the target file).

For more information on joining data sources, see the WebFOCUS InfoAssist User's Manual.

Note:

Preprocessing Other Component

The Preprocessing Other component contains custom code that must run before all other components. You can use the text editor in the component to create and edit code or to paste the code that you have copied from another application.

To create or edit a Preprocessing Other component, do one of the following:

  • Double-click the component.
  • Select the component and click Edit on the ribbon.
  • Right-click the component and select Edit.

The Preprocessing Other text editor appears.

Postprocessing Other Component

The Postprocessing Other component contains custom code that must run after all other components. You can use the text editor in the component to create and edit code, or to paste the code that you have copied from another application.

To create or edit a Postprocessing Other component, double-click the component, or select the component and click Edit on the ribbon. Alternatively, right-click the component and select Edit. The Postprocessing Other dialog box opens.

User Options in Phone Mode

You have a number of options in Phone mode, including robust filtering and hover capabilities.

Filtering

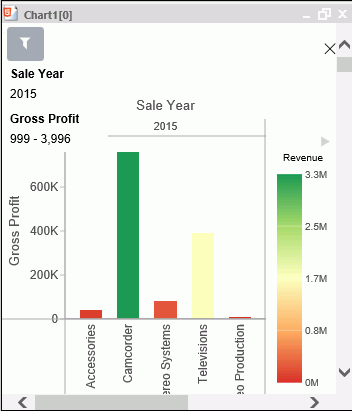
In Phone mode, you can filter just like in regular desktop mode. The primary difference is that the filter shelf stacks the available filters in a vertical row, as shown in the following image.

Creating Circle Plot Charts

Use circle plot charts to display differing values in rows, enabling you to draw inferences as to how the values overlap.

Note: Circle plot charts require at least one measure and one dimension, as well as one for the Detail and Color buckets. Optionally, add a dimension to the Size bucket to view the concentration of data.

The following display options are available for a circle plot chart:

Postprocessing Other Component

The Postprocessing Other component contains custom code that must run after all other components. You can use the text editor in the component to create and edit code, or to paste the code that you have copied from another application.

To create or edit a Postprocessing Other component, double-click the component, or select the component and click Edit on the ribbon. Alternatively, right-click the component and select Edit. The Postprocessing Other dialog box opens.

Chart Component

The Chart component works exactly like the Report component. The Chart component creates a chart template and saves it in a Reporting Object. Authorized users can use the chart template to create a chart that suits their needs and then save the new chart.

To create a chart template, double-click the Chart component, or right-click the component and select Open. InfoAssist opens, allowing you to create a chart template.

For more information on using InfoAssist, see the WebFOCUS InfoAssist User's Manual.

Note: