How to Configure the Adapter for Python
- In the Reporting Server Web Console, go to the Connect to Data page by clicking Connect to Data on the sidebar.
- Click New Datasource on the menu bar, the right-click PYTHON. Note that PYTHON can be found in the Statistics category on the Available drop-down list.
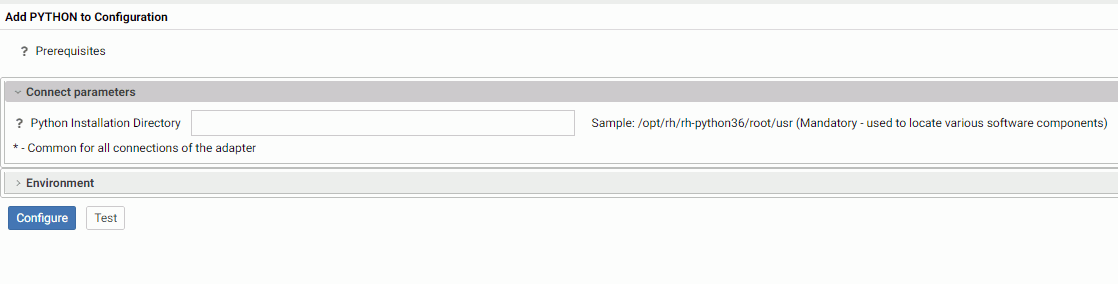
The Add PYTHON to Configuration page opens, as shown in the following image.